作者:gaogy
文章目录
背景
最近很多小伙伴咨询关于基于Vue3框架搭建iClent开发环境并使用Echarts与MapV等第三方可视化库的问题。本文就以iClient for Leaflet为例,在新一代前端框架构建工具Vite与Vue3项目中,演示如何搭建iClent开发环境并使用Echarts与MapV等第三方可视化库。
本文所使用的依赖与配置项如下:
"@supermap/iclient-leaflet": "^11.0.1",
"vue": "^3.2.47",
"@vitejs/plugin-vue": "^4.1.0",
"vite": "^4.3.2"
一、使用Vite构建Vue3+JavaScript项目
使用vite构建必须先安装node与vue环境,并安装vite工具,安装操作可自行百度。以下为项目创建步骤:
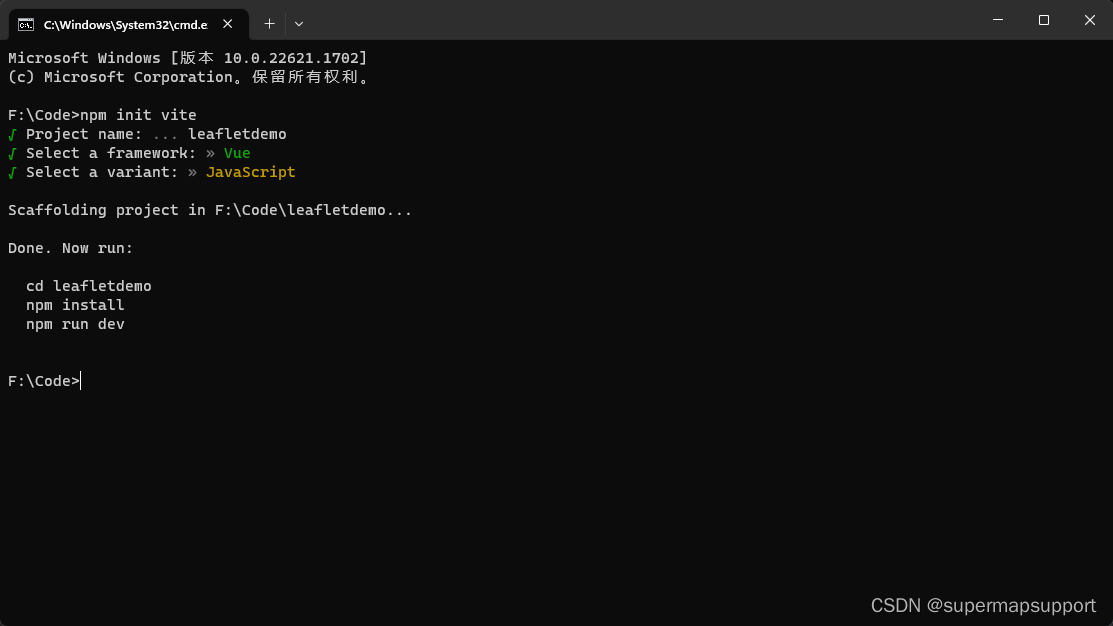
1、运行创建项目命令
npm init vite
2、输入项目名称,选择前端框架为Vue,选择项目类型为JavaScript
3、执行cd leafletdemo、npm install 与 npm run dev命令
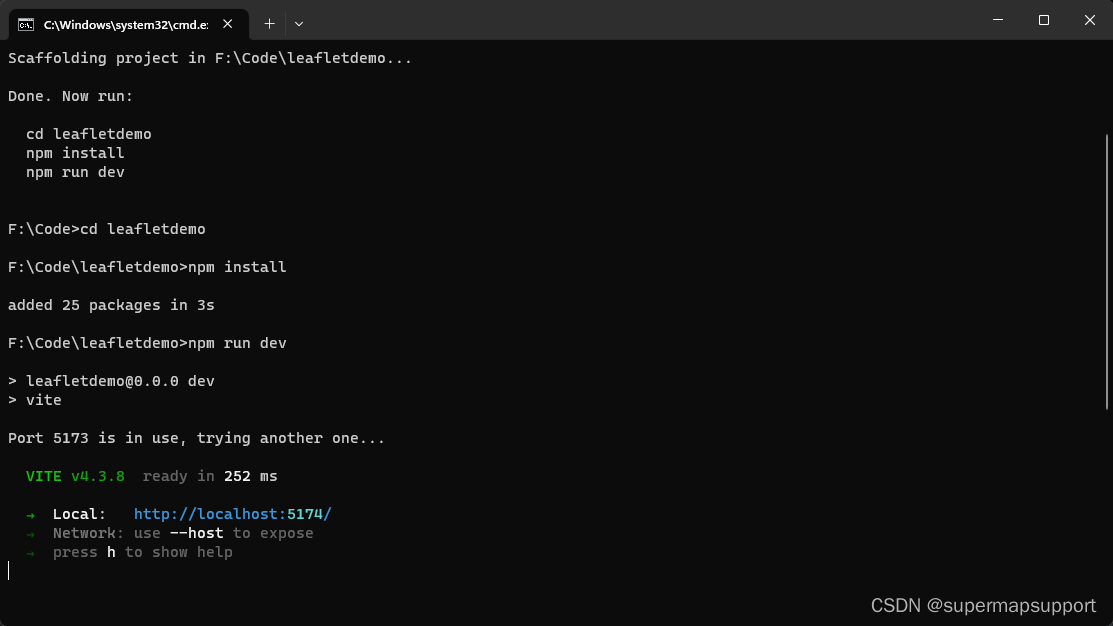
4、访问http://localhost:5174/,确认项目成功创建

二、搭建iClient for Leaflet开发环境
1、在命令行中输入以下命令安装 SuperMap iClient for Leaflet:
npm install @supermap/iclient-leaflet
2、在index.html文件的标签中引入 Leaflet CSS 文件和 iclient-leaflet CSS 文件,如下:
<!DOCTYPE html>
<html lang="en">
  <head>
    <meta charset="UTF-8" />
    <link rel="icon" type="image/svg+xml" href="/vite.svg" />
    <meta name="viewport" content="width=device-width, initial-scale=1.0" />
    <link rel="stylesheet" href="https://unpkg.com/[email protected]/dist/leaflet.css" />
    <link rel="stylesheet" href="https://iclient.supermap.io/dist/leaflet/iclient-leaflet.min.css" />
    <title>Vite + Vue + Leaflet</title>
  </head>
  <body>
    <div id="app"></div>
    <script type="module" src="/src/main.js"></script>
  </body>
</html>
3、在componets文件夹中新建一个Map组件,创建一个id为map的div标签,并设置其style样式;使用按需引入方式引入相应模块;然后在methods中写入初始化地图函数init,并在mouted中运行init函数。
<template>
  <div id="map"></div>
</template>

<script>
import L from 'leaflet'
import {

     TiledMapLayer } from '@supermap/iclient-leaflet'

export default {


  name: 'MapView',
  data() {


    return {


      map: {

    },
      mapUrl: 'https://iserver.supermap.io/iserver/services/map-china400/rest/maps/China'
    }
  },
  mounted() {


    this.init()
  },
  methods: {


    init() {


      this.map = L.map('map', {


        center: [40, 117],
        maxZoom: 18,
        zoom: 4
      })
      new TiledMapLayer(this.mapUrl).addTo(this.map)
    }
  }
}
</script>

<style>
#map {


  margin: 0;
  padding: 0;
  overflow: hidden;
  background: #fff;
  width: 100%;
  height: 100%;
  position: absolute;
}
</style>
4、在App.vue中引入我们刚才创建的Map组件
<script setup>
import Map from './components/Map.vue'
</script>

<template>
  <Map />
</template>

<style>
body {


  margin: 0;
  padding: 0;
}
</style>
5、使用npm run dev 命令运行项目,在浏览器中打开,发现控制台报如下错误:

产生原因与解决办法可以参考博客https://blog.csdn.net/supermapsupport/article/details/123569581。首先在package.json>devDependencies里增加
 "events": "^3.3.0",
 "util": "^0.12.4",

然后在vite.config.js ,增加define配置

最后ctrl+c结束运行项目,使用那npm install命令安装一下需要的模块后,再使用npm run dev命令运行项目如下:
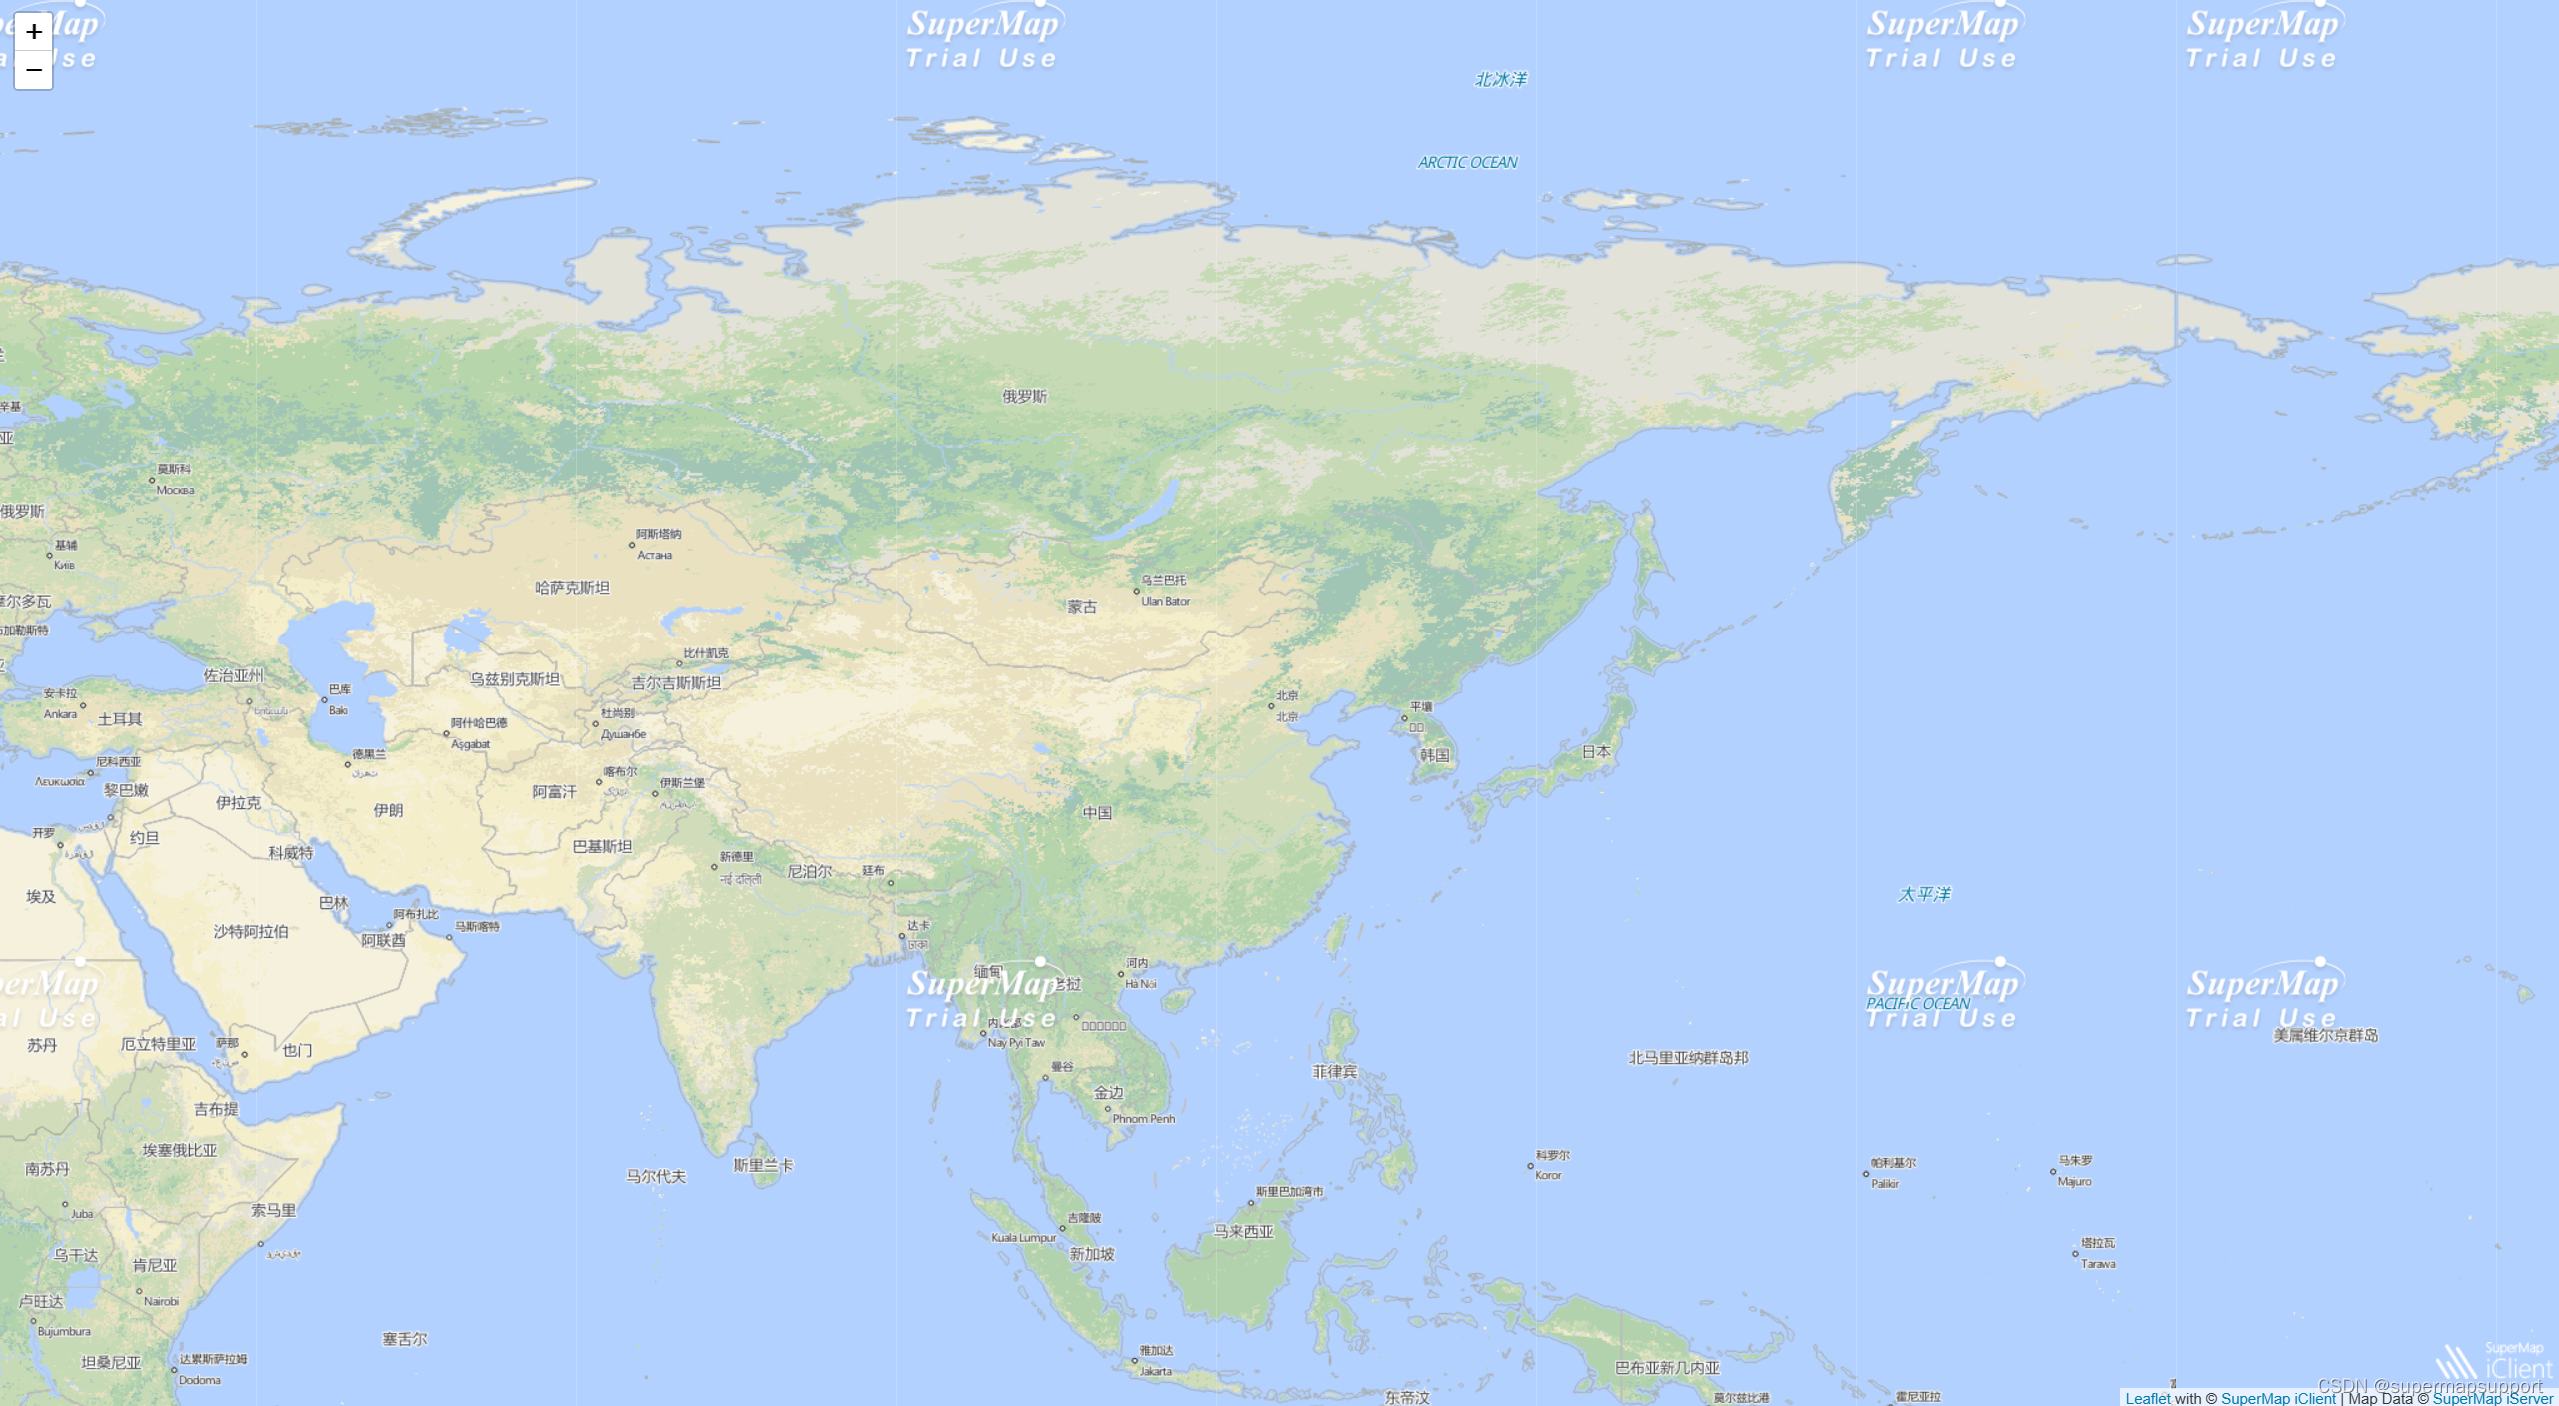
至此,iClient for Leaflet开发环境搭建成功
三、第三方可视化库Echarts的使用
由于iclient-leaflet中已经包含了Echarts库,所以在搭建好iClient for Leaflet开发环境后不需要单独下载Echarts库,使用的时候只需要引入echarts模块就行
import echarts from 'echarts'
初始化Echarts实例对象
let div = L.DomUtil.create('div')
this.chart = echarts.init(div, '', {


  width: 600,
  height: 400
})
指定配置项和数据(option)
this.option = {


  title: {


    subtext: '数据纯属虚构'
  },
  tooltip: {


    trigger: 'axis'
  },
  legend: {


    //data:["最高气温"]
    data: ['最高气温', '最低气温']
  },
  toolbox: {


    show: true,
    feature: {


      dataZoom: {


        yAxisIndex: 'none'
      },
      magicType: {

     type: ['line', 'bar'] },
      restore: {

    },
      saveAsImage: {

    }
    }
  },
  xAxis: {


    type: 'category',
    boundaryGap: false,
    data: ['周一', '周二', '周三', '周四', '周五', '周六', '周日']
  },
  yAxis: {


    type: 'value',
    axisLabel: {


      formatter: '{value} °C'
    }
  },
  series: [
    {


      name: '最高气温',
      type: 'line',
      data: [11, 11, 15, 13, 12, 13, 10],
      markPoint: {


        data: [
          {

     type: 'max', name: '最大值:' },
          {

     type: 'min', name: '最小值:' }
        ]
      },
      markLine: {


        data: [
          {

     type: 'average', name: '平均值' },
          [
            {


              symbol: 'none',
              x: '90%',
              yAxis: 'max'
            },
            {


              symbol: 'circle',
              label: {


                normal: {


                  position: 'start',
                  formatter: '最大值:'
                }
              },
              type: 'max',
              name: '最高点'
            }
          ]
        ]
      }
    },
    {


      name: '最低气温',
      type: 'line',
      data: [1, -2, 2, 5, 3, 2, 0],
      markPoint: {


        data: [
          {

     type: 'max', name: '最大值:' },
          {

     type: 'min', name: '最小值:' }
        ]
      },
      markLine: {


        data: [
          {

     type: 'average', name: '平均值' },
          [
            {


              symbol: 'none',
              x: '90%',
              yAxis: 'min'
            },
            {


              symbol: 'circle',
              label: {


                normal: {


                  position: 'start',
                  formatter: 'Z值范围 最小值:'
                }
              },
              type: 'min',
              name: '最低点'
            }
          ]
        ]
      }
    }
  ]
}
this.chart.setOption(this.option)
在这里使用地图服务查询省会城市,渲染到地图中,并且绑定popup
let param = new QueryBySQLParameters({


  queryParams: [
    {


      name: 'China_ProCenCity_pt@China',
      attributeFilter: '1 = 1'
    },
    {


      name: 'China_Capital_pt@China',
      attributeFilter: '1 = 1'
    }
  ]
})
new QueryService(this.mapChinaUrl).queryBySQL(param, serviceResult => {


  serviceResult.result.recordsets.map(record => {


    that.resultLayer = L.geoJSON(record.features, {


      coordsToLatLng: coords => {


        let latlng = L.CRS.EPSG3857.unproject(L.point(coords[0], coords[1]))
        latlng.alt = coords[2]
        return latlng
      }
    }).bindPopup(
      layer => {


        let city = layer.feature.properties.NAME
        that.chart.setOption({


          title: {


            text: city + '未来一周气温变化'
          },
          series: [
            {


              name: '最高气温',
              data: [10 + Math.ceil(Math.random() * 10), 10 + Math.ceil(Math.random() * 10), 10 + Math.ceil(Math.random() * 10), 10 + Math.ceil(Math.random() * 10), 10 + Math.ceil(Math.random() * 10), 10 + Math.ceil(Math.random() * 10), 10 + Math.ceil(Math.random() * 10)]
            },
            {


              name: '最低气温',
              data: [8 - Math.ceil(Math.random() * 10), 8 - Math.ceil(Math.random() * 10), 8 - Math.ceil(Math.random() * 10), 8 - Math.ceil(Math.random() * 10), 8 - Math.ceil(Math.random() * 10), 8 - Math.ceil(Math.random() * 10), 8 - Math.ceil(Math.random() * 10)]
            }
          ]
        })
        return that.chart.getDom()
      },
      {

     maxWidth: 700 }
    ).addTo(that.map)
  })
})
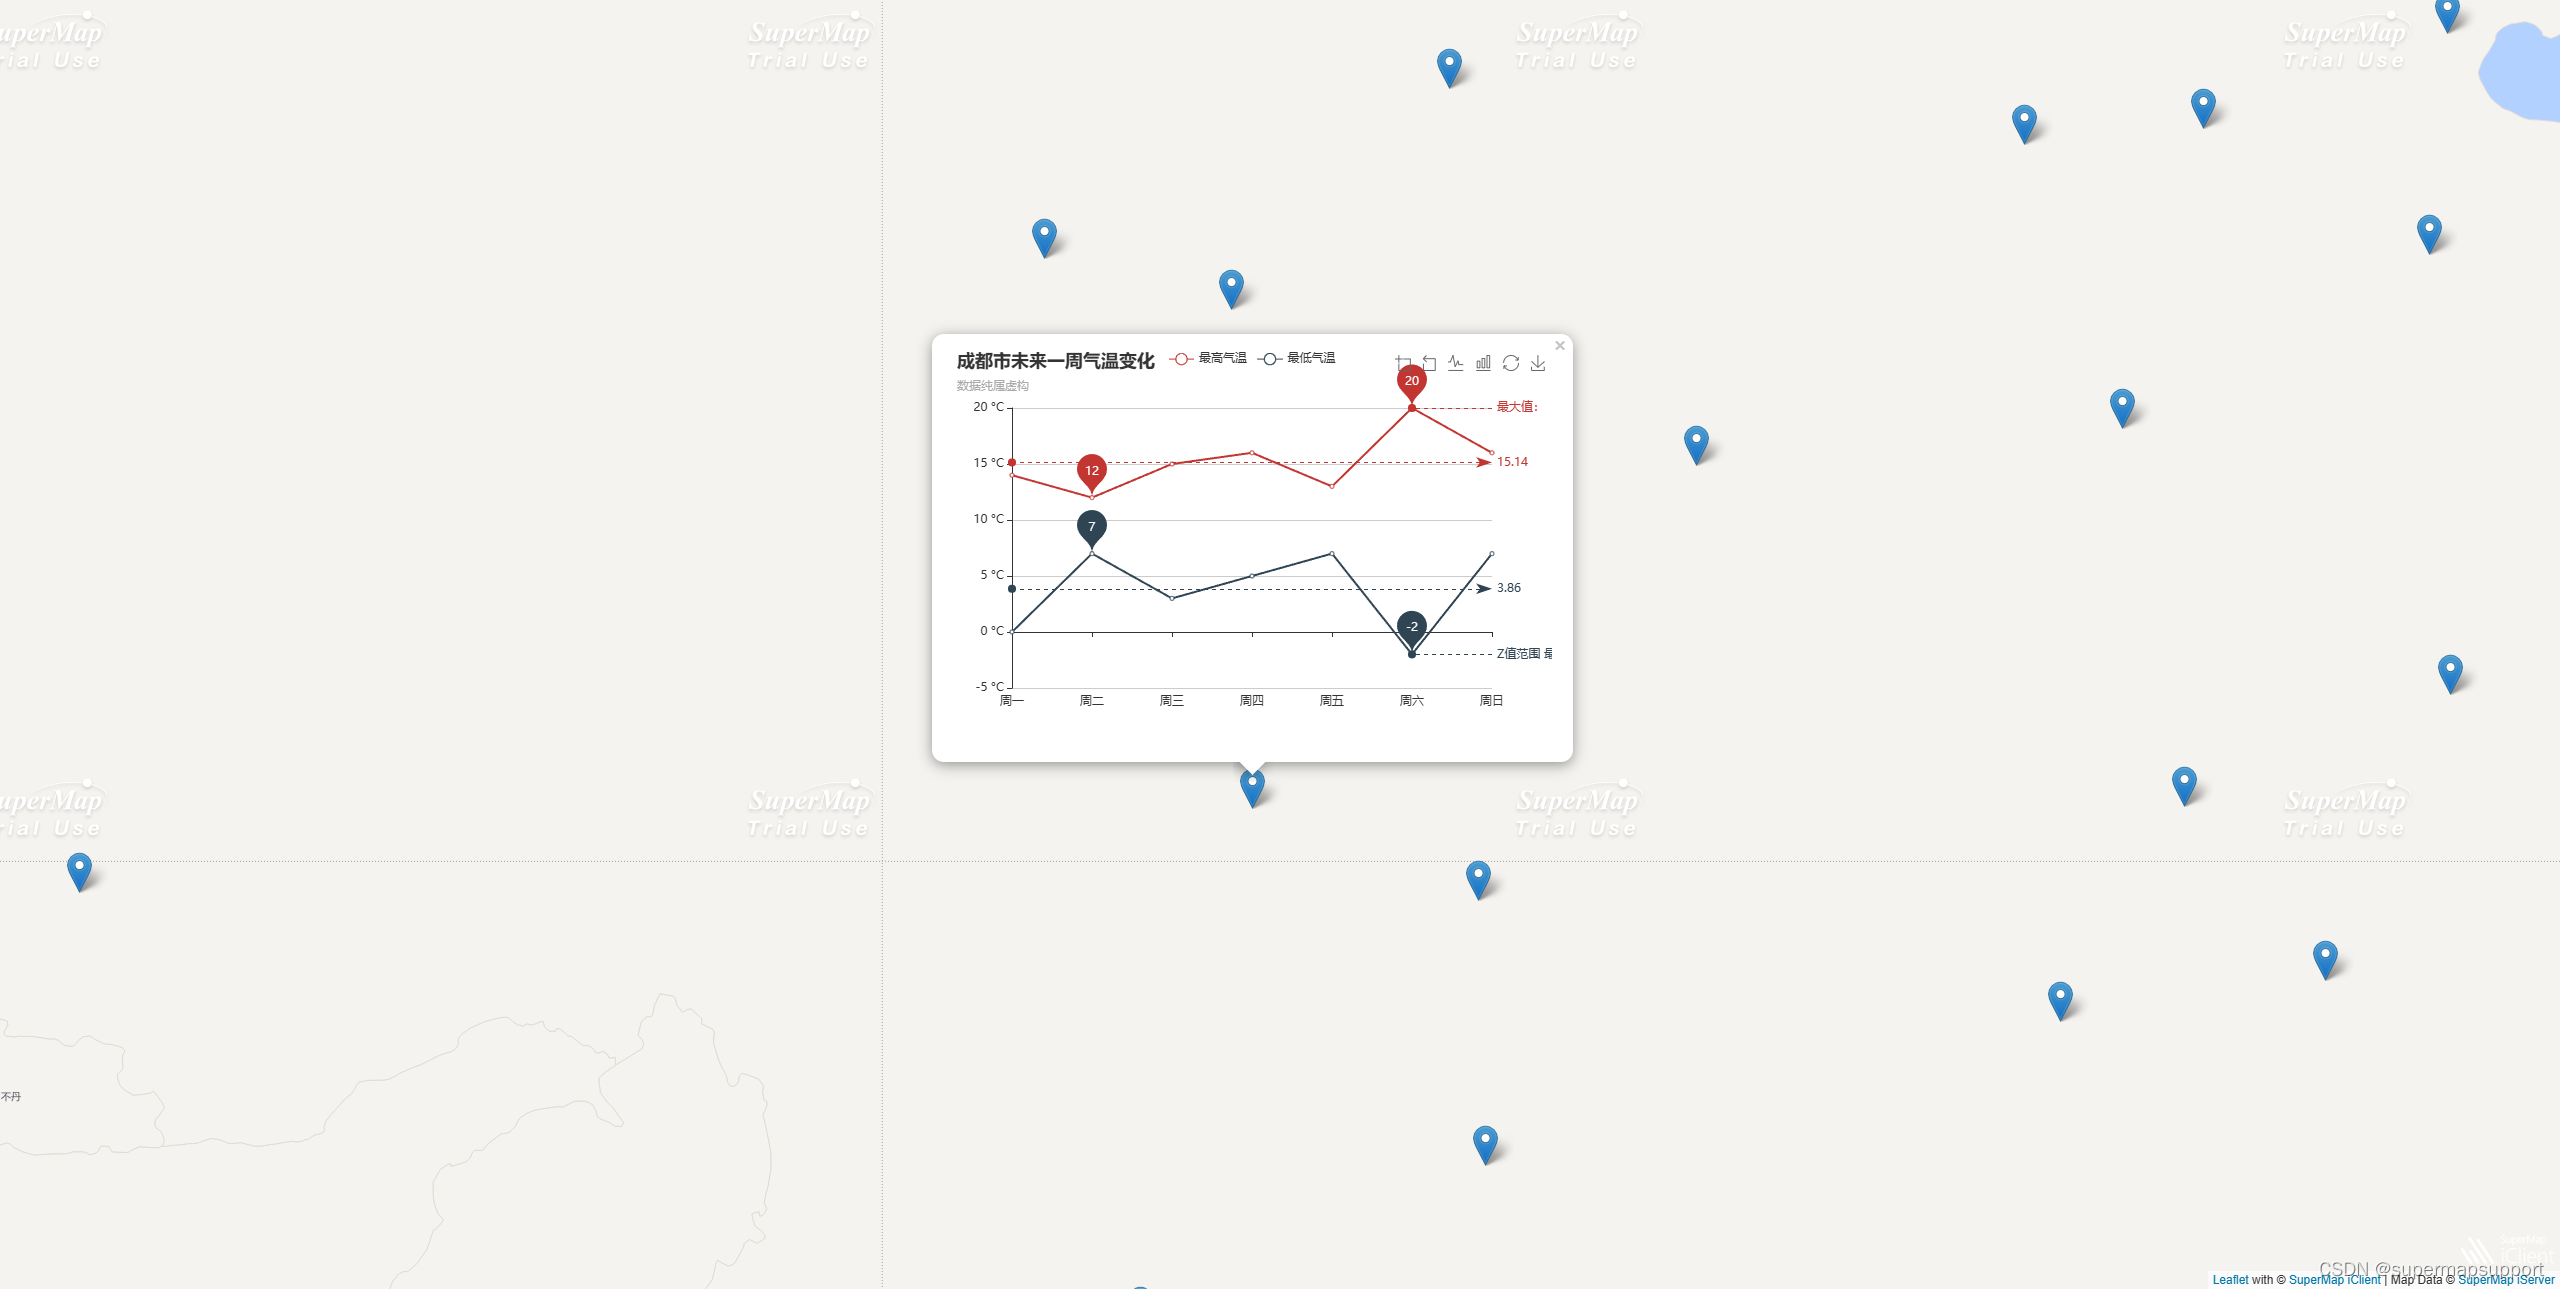
运行项目,查看效果如下:
四、第三方可视化库MapV的使用
由于iclient-leaflet中已经包含了MapV库,所以在搭建好iClient for Leaflet开发环境后不需要单独下载MapV库,使用的时候只需要引入相应模块就行。与Echarts不同的是,MapV的模块需要按需引入,或者使用以下方式全部引入
import * as mapv from 'mapv'
然后,按需引入MapVLayer
import {

     MapVLayer } from '@supermap/iclient-leaflet'
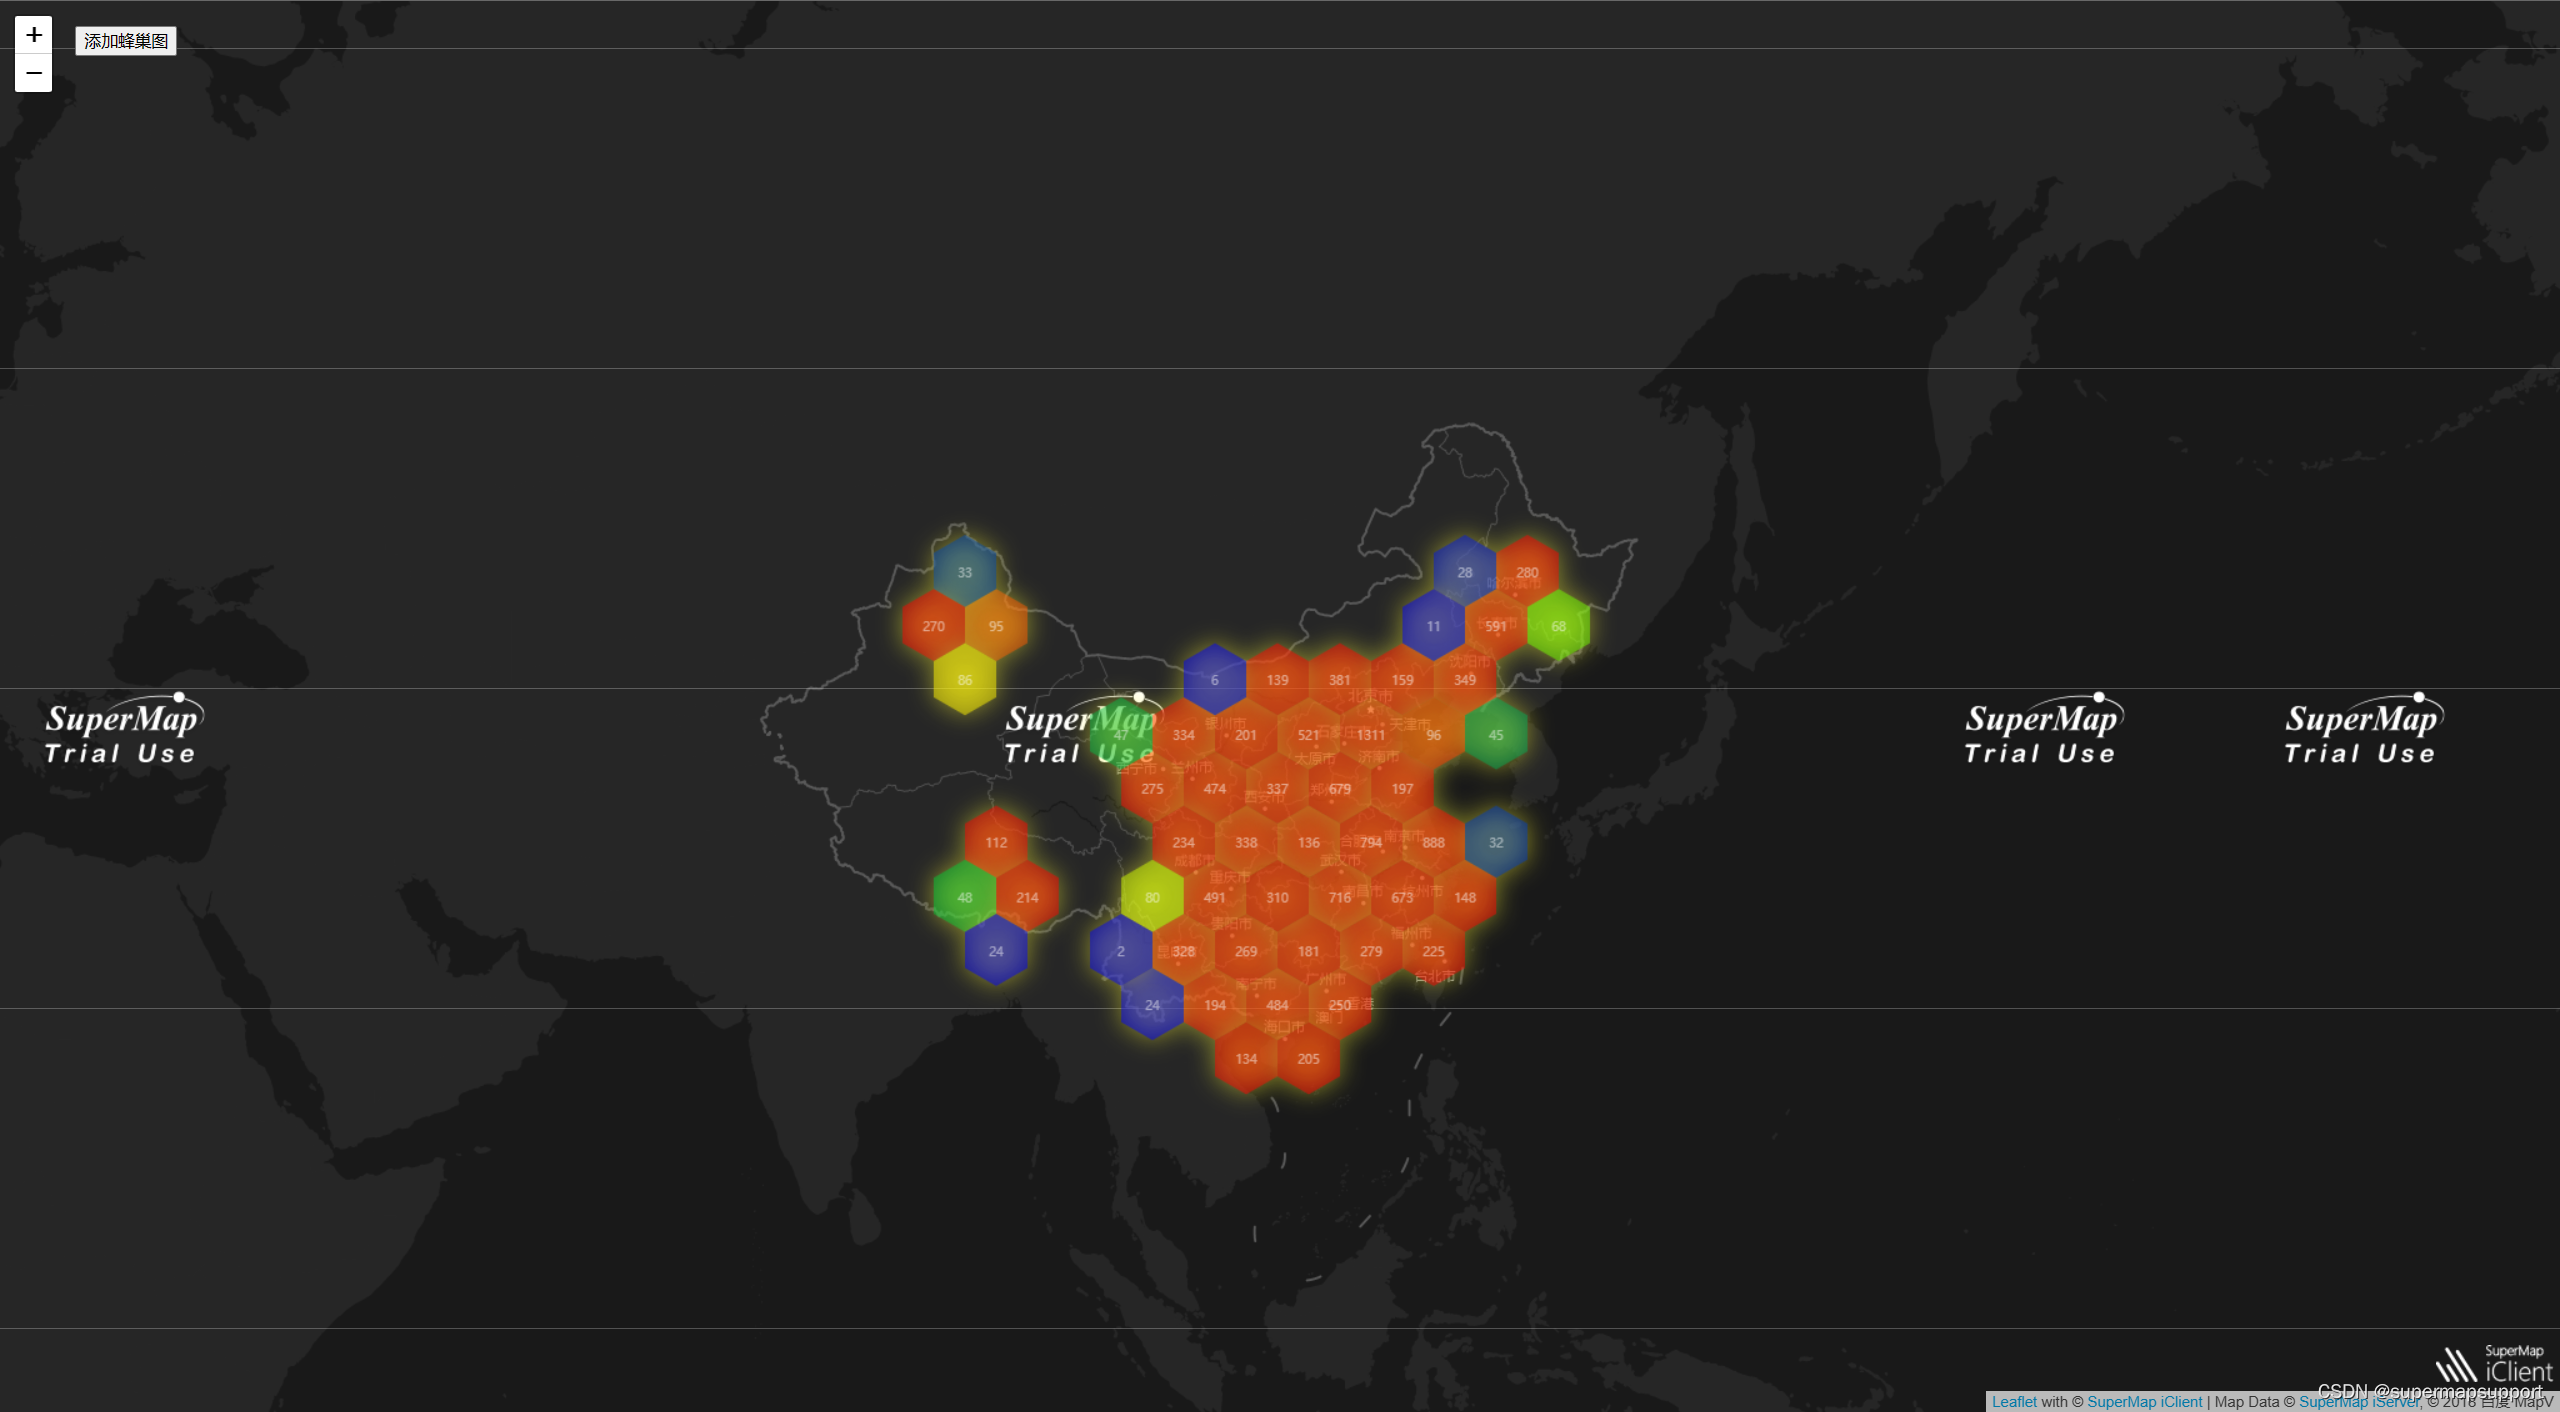
最后,我们随机构造一些数据作为蜂巢图的数据用于展示。
let randomCount = 1000
let data = []
// 构造数据
while (randomCount--) {


  let cityCenter = mapv.utilCityCenter.getCenterByCityName(this.citys[parseInt(Math.random() * this.citys.length)])
  data.push({


    geometry: {


      type: 'Point',
      coordinates: [cityCenter.lng - 2 + Math.random() * 4, cityCenter.lat - 2 + Math.random() * 4]
    },
    count: 30 * Math.random()
  })
}
let dataSet = new mapv.DataSet(data)
let options = {


  fillStyle: 'rgba(55, 50, 250, 0.8)',
  shadowColor: 'rgba(255, 250, 50, 1)',
  shadowBlur: 20,
  max: 100,
  size: 50,
  unit: 'px', // unit可选值['px', 'm'],默认值为'px'
  label: {


    show: true,
    fillStyle: 'white'
  },
  globalAlpha: 0.5,
  gradient: {

     0.25: 'rgb(0,0,255)', 0.55: 'rgb(0,255,0)', 0.85: 'yellow', 1.0: 'rgb(255,0,0)' },
  draw: 'honeycomb'
}
new MapVLayer(dataSet, options).addTo(this.map) //创建MapV图层
运行项目,查看效果如下:
五、其他地图库
针对iClient for MapboxGL与iClient for OpenLayers引入方式与Leaflet相同,只需替换css、引入模块及初始化代码即可; iClient for Classic 引入地址,安装后按照module中的README进行使用。
完整Demo可参考下载资源,链接: Vite+Vue+iClient for Leaflet引入并实现MapV/Eharts第三方可视化库示例