# library
library(latticeExtra)
# create data
set.seed(1)
data <- data.frame(x = rnorm(100), y = rnorm(100))
data$z <- with(data, x * y + rnorm(100, sd = 1))
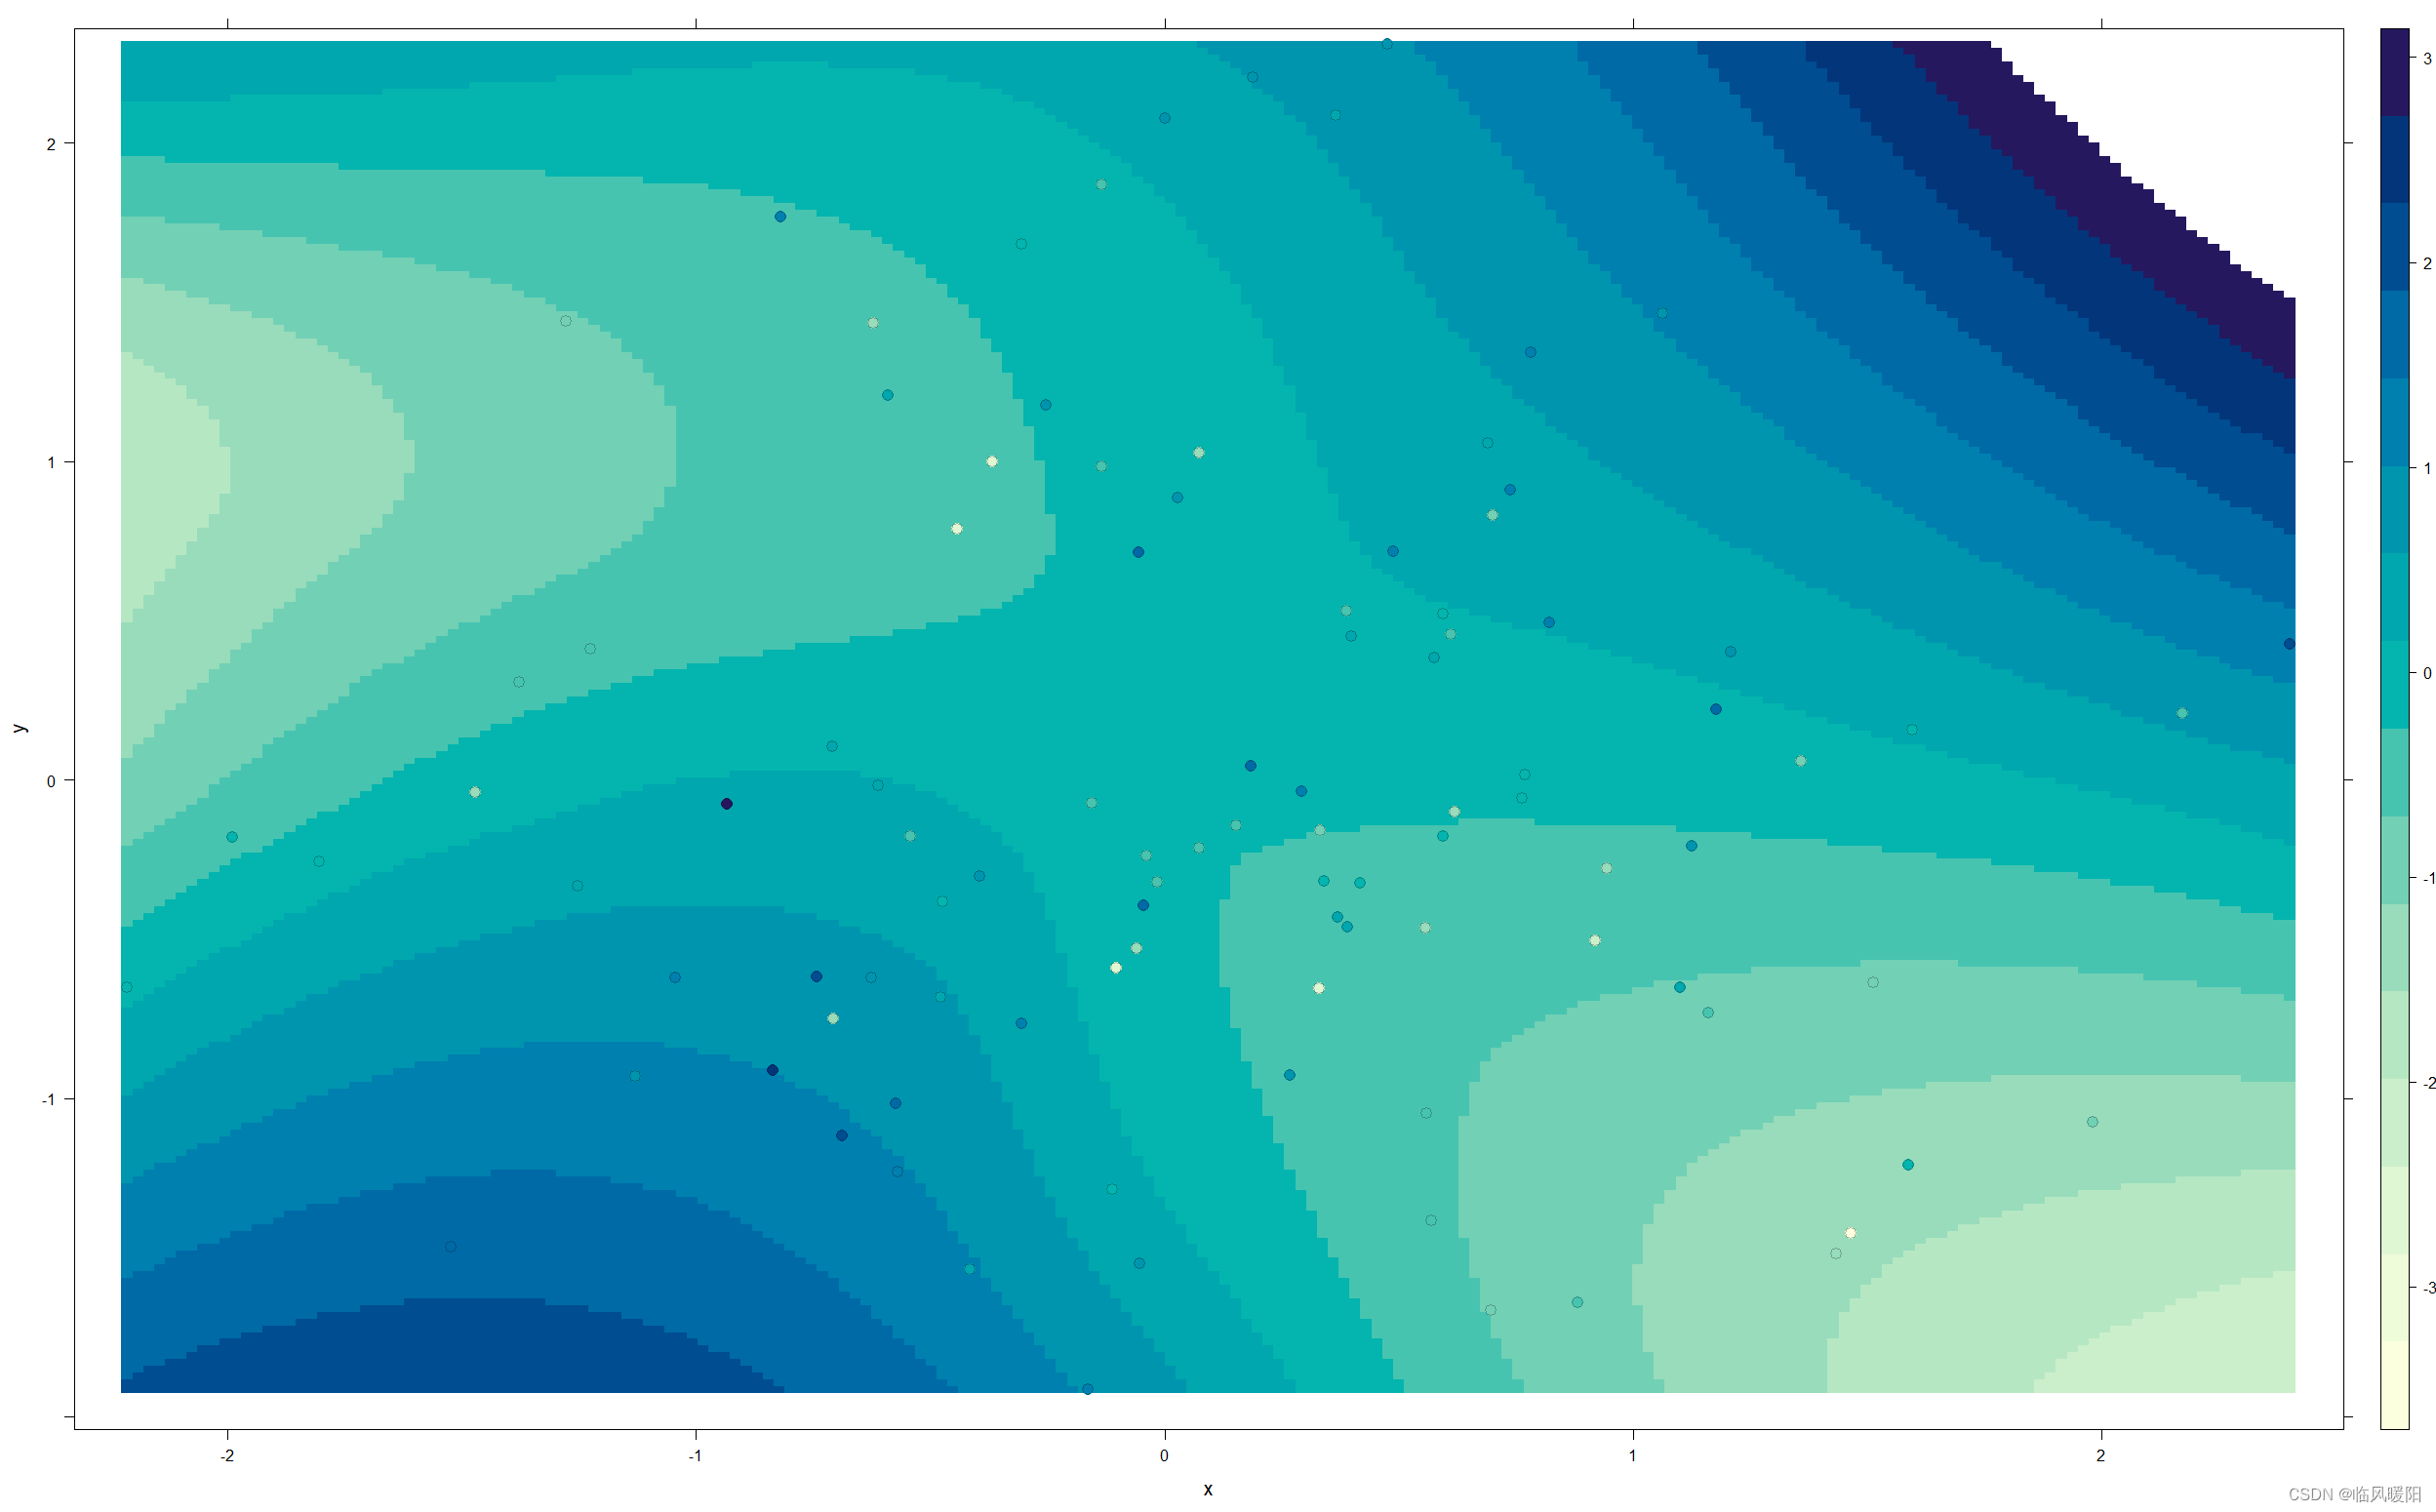
# showing data points on the same color scale
levelplot(z ~ x * y, data,
panel = panel.levelplot.points, cex = 1.2
) +
layer_(panel.2dsmoother(..., n = 200))
参考文献:https://blog.csdn.net/weixin_46587777/article/details/124973766
开发工具:RStudio 2023.06.1 Build 524
微信Alt+A截屏工具