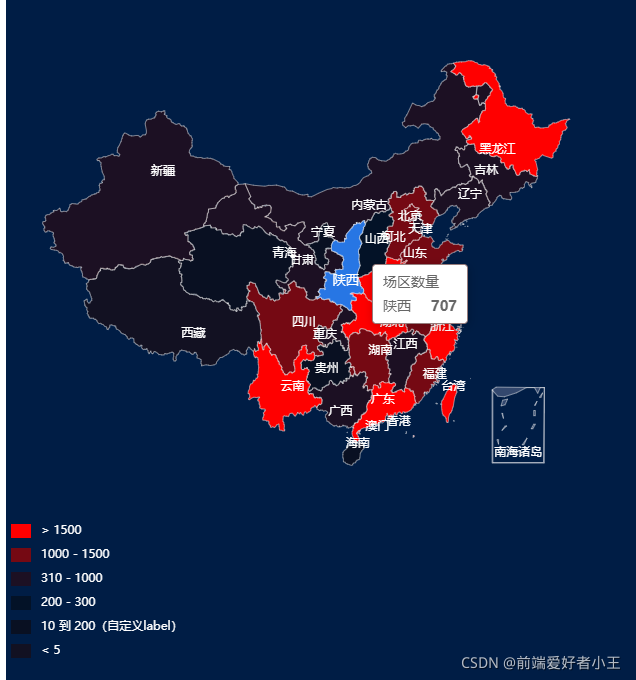
先看效果图
第一步:脚手架中引入echarts
npm 安装
npm install echarts --save
//引入echarts
import * as echarts from 'echarts/core';
//图表类型按需
import {


  BarChart,
  LineChart
} from 'echarts/charts';
//组件类型按需
import {


  TitleComponent,
  TooltipComponent,
  GridComponent,
  VisualMapComponent     //!!!!地图必不可缺的组件
} from 'echarts/components';
import {


  CanvasRenderer
} from 'echarts/renderers';
//注册组件
echarts.use(
  [TitleComponent, TooltipComponent, GridComponent, BarChart,LineChart, CanvasRenderer,VisualMapComponent]
);
//全局引入echarts
Vue.prototype.$echarts = echarts
第二步 组件中引入china.js
因为echarts新版本不在有china.js,所以需要自己下载引入
#下载链接
http://www.wangsm.top/#/tools
第三步 创建地图组件并进行配置
代码如下:每一条属性我都有写注释请自行尝试体验,只展示部分常用的属性,更多api请参考https://echarts.apache.org/zh/option.html#title

<template>
  <div class="bc">
    <div ref="map" style="width:600px;height:800px"></div>
  </div>
</template>

<style></style>

<script>
import "./china";
export default {


  data() {


    return {


      option: {


        title: {


          text: "中国地图",
          subtext: "国内场区分布",
          color:"#fff"
        },
        series: [
          {


            name: "场区数量", //名称
            type: "map", //对应的图标类型
            map: "china", //对应的地图名称
            zoom: "1.1", //缩放的倍数当前为放大1.1倍
            roam: true, //是否在中心点显示文字
            label: {


              show: true, //是否显示地图上方的省的名字
              color: "#fff",
              fontSize: 12, //显示字体的大小
              fontWeight: 400,
            },
            data: [], //地图内填充的数据  格式为{

    {name:'',value:''}}
            itemStyle: {


              areaColor: "#33486E", //控制区域的背景颜色
              borderColor: "#eee", //控制区域周边边框的颜色
            },
            select: {


              //区域被选中时的一些样式
              //文字样式
              label: {


                color: "#fff",
              },
              //区域样式
              itemStyle: {


                areaColor: "#2776E4", //控制区域的背景颜色
              },
            },
            //高亮显示的区域
            emphasis: {


              label: {


                fontSize: 13,
                color: "#fff",
              },
              itemStyle: {


                areaColor: "#2776E4", //控制区域的背景颜色
              },
            },
          },
        ],
        //鼠标悬浮展示数据
        tooltip: {


          trigger: "item",
        },
        //视觉映射
        visualMap: {


          type:"piecewise",
          show:true,
          //piecewise: true, // 开启后pieces和地图在同一块div内
          pieces: [
            {

     min: 1500 }, // 不指定 max,表示 max 为无限大(Infinity)。
            {

     min: 900, max: 1500 },
            {

     min: 310, max: 1000 },
            {

     min: 200, max: 300 },
            {

     min: 10, max: 200, label: "10 到 200(自定义label)" },
           //  { min: 10, max: 200, label: "10 到 200(自定义label)" },
           // { value: 123, label: "123(自定义特殊颜色)", color: "grey" }, // 表示 value 等于 123 的情况。
            {

     max: 5 }, // 不指定 min,表示 min 为无限大(-Infinity)。
          ],
          //选择文字块时地图区域的颜色的颜色
          inRange: {


            symbol:"rect",//配置文字前面方块的形状,目前为长方形 circle为圆形
            color: ["#121122", "rgba(3,4,5,0.4)", "red"],
            symbolSize: [30, 100],
          },
          //设置范围区间的文字颜色
          textStyle:{


            color:"#fff"
          }
        },
      },
      myChart: undefined,
    };
  },
  components: {

    },
  mounted() {


    this.getData();
    var myChart = this.$echarts.init(this.$refs.map);
    myChart.setOption(this.option);
    this.myChart = myChart;
  },
  methods: {


    //进入获取数据
    getData() {


      this.$axios("/test/news/wap/fymap2020_data.d.json")
        .then((res) => {


          const List = res.data.data.list.map((item) => {


            return {


              name: item.name,
              value: item.value,
            };
          });
          //从后端请求数据
          this.option.series[0].data = List;
          //进行地图赋值
          this.myChart.setOption(this.option);
        })
        .catch((err) => {


          console.log(err);
        });
    },
  },
};
</script>
<style lang="scss" scoped>
.bc {


  width: 100vw;
  height: 100vh;
  background-color: #001d45;
}
</style>