转自:add_subplot()--matplotlib_牵牛花主人的博客-CSDN博客
1. add_subplot()函数
1.1 函数功能
Add an Axes to the figure as part of a subplot arrangement.
- 1
在画布中增加轴域
1.2 函数语法:
add_subplot(nrows, ncols, index, **kwargs)
- 1
1.3 函数参数
1.3.1 nrows, ncols, index
子图的位置由以下三个参数决定:
Three integers (nrows, ncols, index).
The subplot will take the index position on a grid with nrows rows and ncols columns.
index starts at 1 in the upper left corner and increases to the right.
index can also be a two-tuple specifying the (first, last) indices (1-based, and including last) of the subplot,
e.g., fig.add_subplot(3, 1, (1, 2)) makes a subplot that spans the upper 2/3 of the figure.
- 1
- 2
- 3
- 4
- 5
参数nrows与ncols决定画布被划分为nrows*ncols几部分。索引index从左上角开始,向右边递增。
索引也可以指定为二元数组,表示图表占据位置为:从索引的第1个参数到第2个参数的位置。
例如: fig.add_subplot(3, 1, (1, 2)),表示子图占据的位置为将画布三等分后的前两份位置。
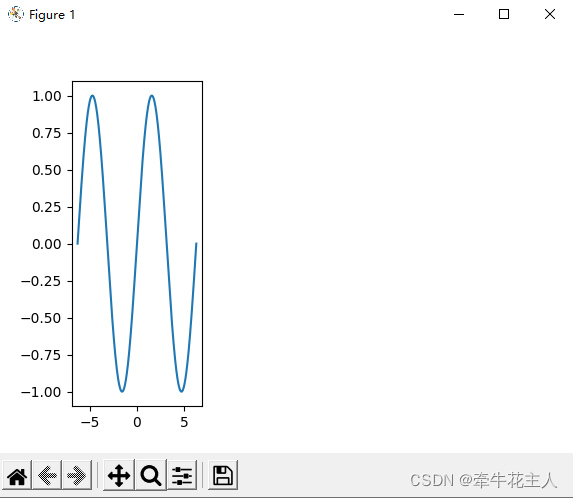
import matplotlib.pyplot as plt
import numpy as np

x1 = np.linspace(-2 * np.pi, 2 * np.pi, 500)
y1 = np.sin(x1)

plt.subplot(1, 3, 1)
plt.plot(x1, y1)

plt.show()
- 1
- 2
- 3
- 4
- 5
- 6
- 7
- 8
- 9
- 10
- 11