LightningChart JS v.4.2 has been released!
Introducing new Developers’ Documentation, Polar heatmaps, improvements for Bar charts, and more!
Polar Heatmaps
Build your next application with LightningChart JS Web-GL and GPU-accelerated charting components
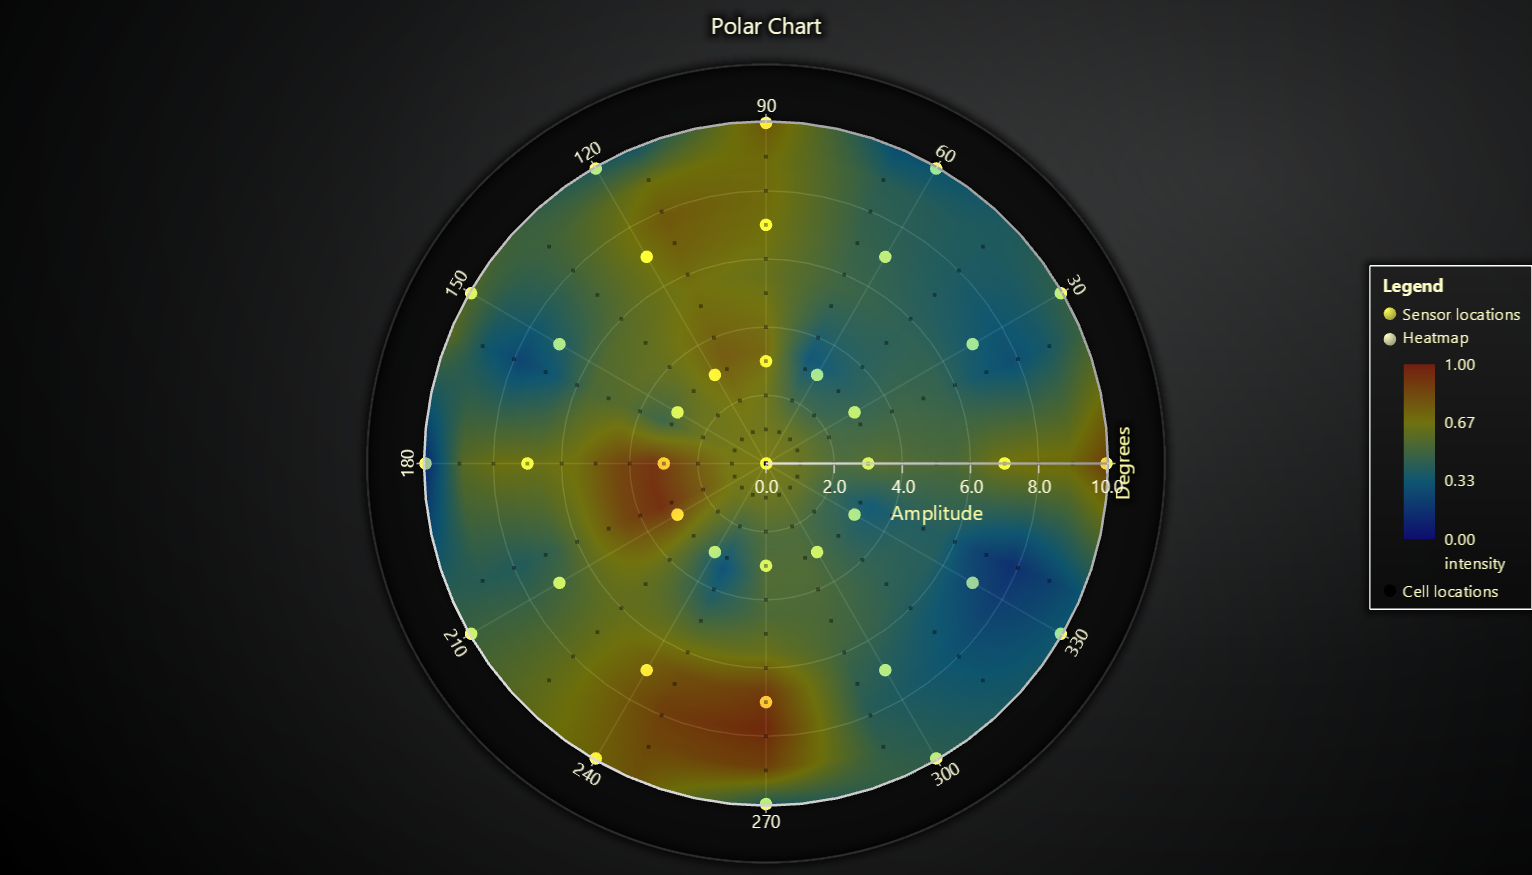
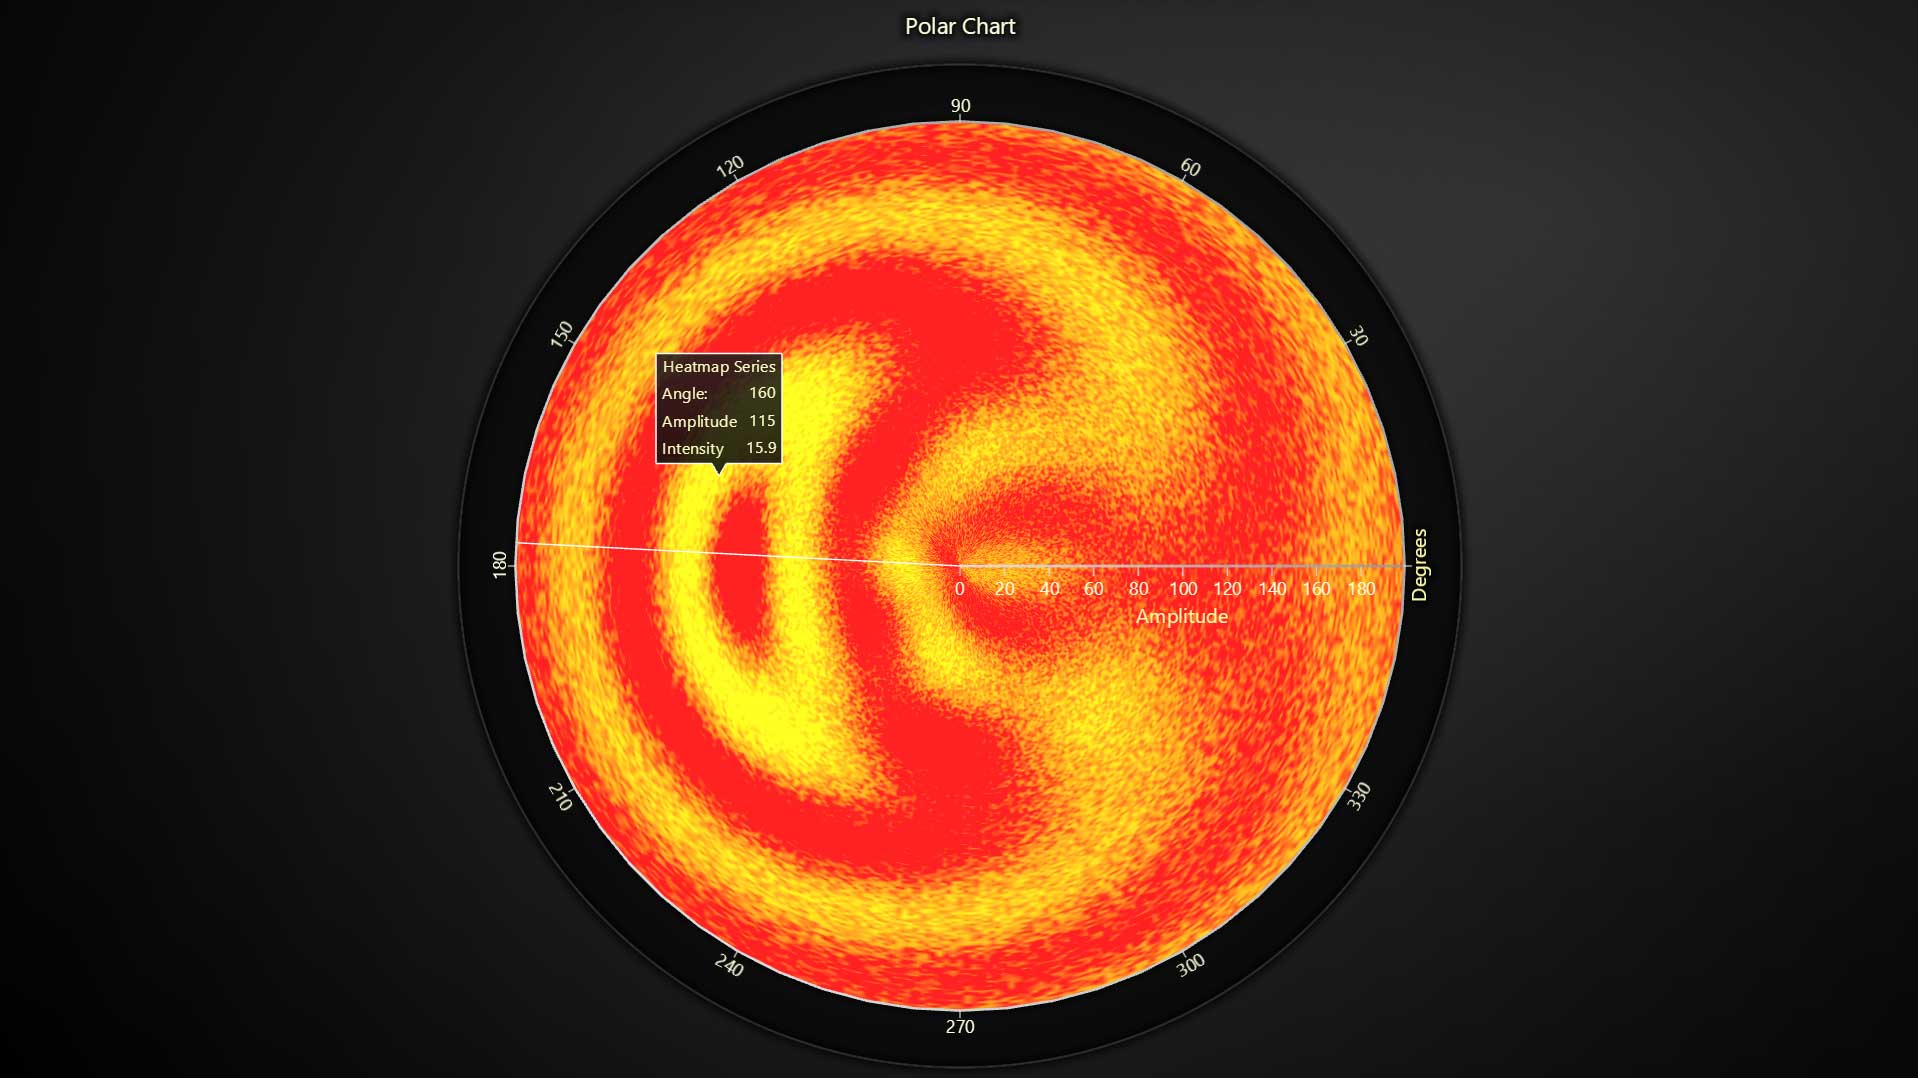
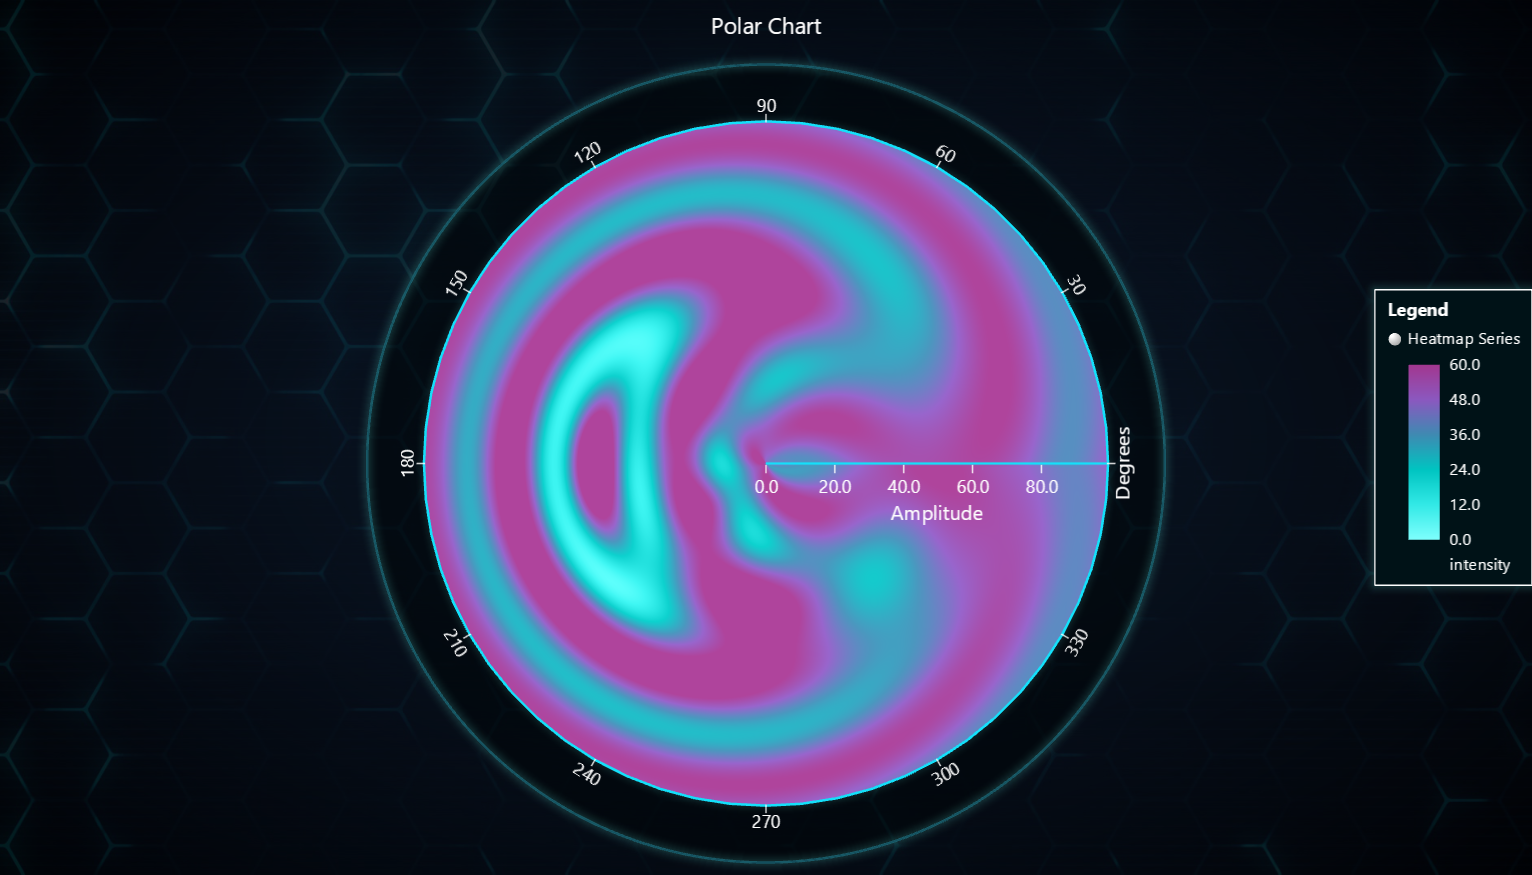
Polar charts feature new series types which allow visualizing heatmaps within a polar coordinate system. This type of Polar chart is commonly used in the defense industry. Some key characteristics of the Polar Heatmaps are:
- Processing up to 4 million data points
- Super fast loading speed and CPU-efficient real-time updates
- 100 ms to fully show the heatmap populated with all the data
- Built-in data cursor feature
- Bilinear color interpolation between data points
JavaScript Real-Time Polar Sensor Chart
JavaScript Polar Radar Heatmap Chart
JavaScript Polar Heatmap Chart
Bar Charts
Bar charts are extensively used for visualizing categorical data and are considered a universal type of chart in different industries and applications. Bar charts are significantly used in Business Intelligence (BI) applications due to their effectiveness and simplicity in representing and analyzing data.
In this release, we’re introducing several features for our JavaScript bar charts, including:
- A convenient API that requires minimal configuration
- To create an interactive bar chart, simply plug in categorical data
- Built-in functions
- DataCursor
- Sorting
- Animations
- Overlapping label hiding
- Supports real-time data input
- Different configuration options for label placement and display
- Custom events can be added for drill-drown or extended cursor functionality
- High-performance
- Supports visualization of a few to hundreds of bar charts at top-performance
- Fully-customizable styling options
- Possible to override the default visual appearance
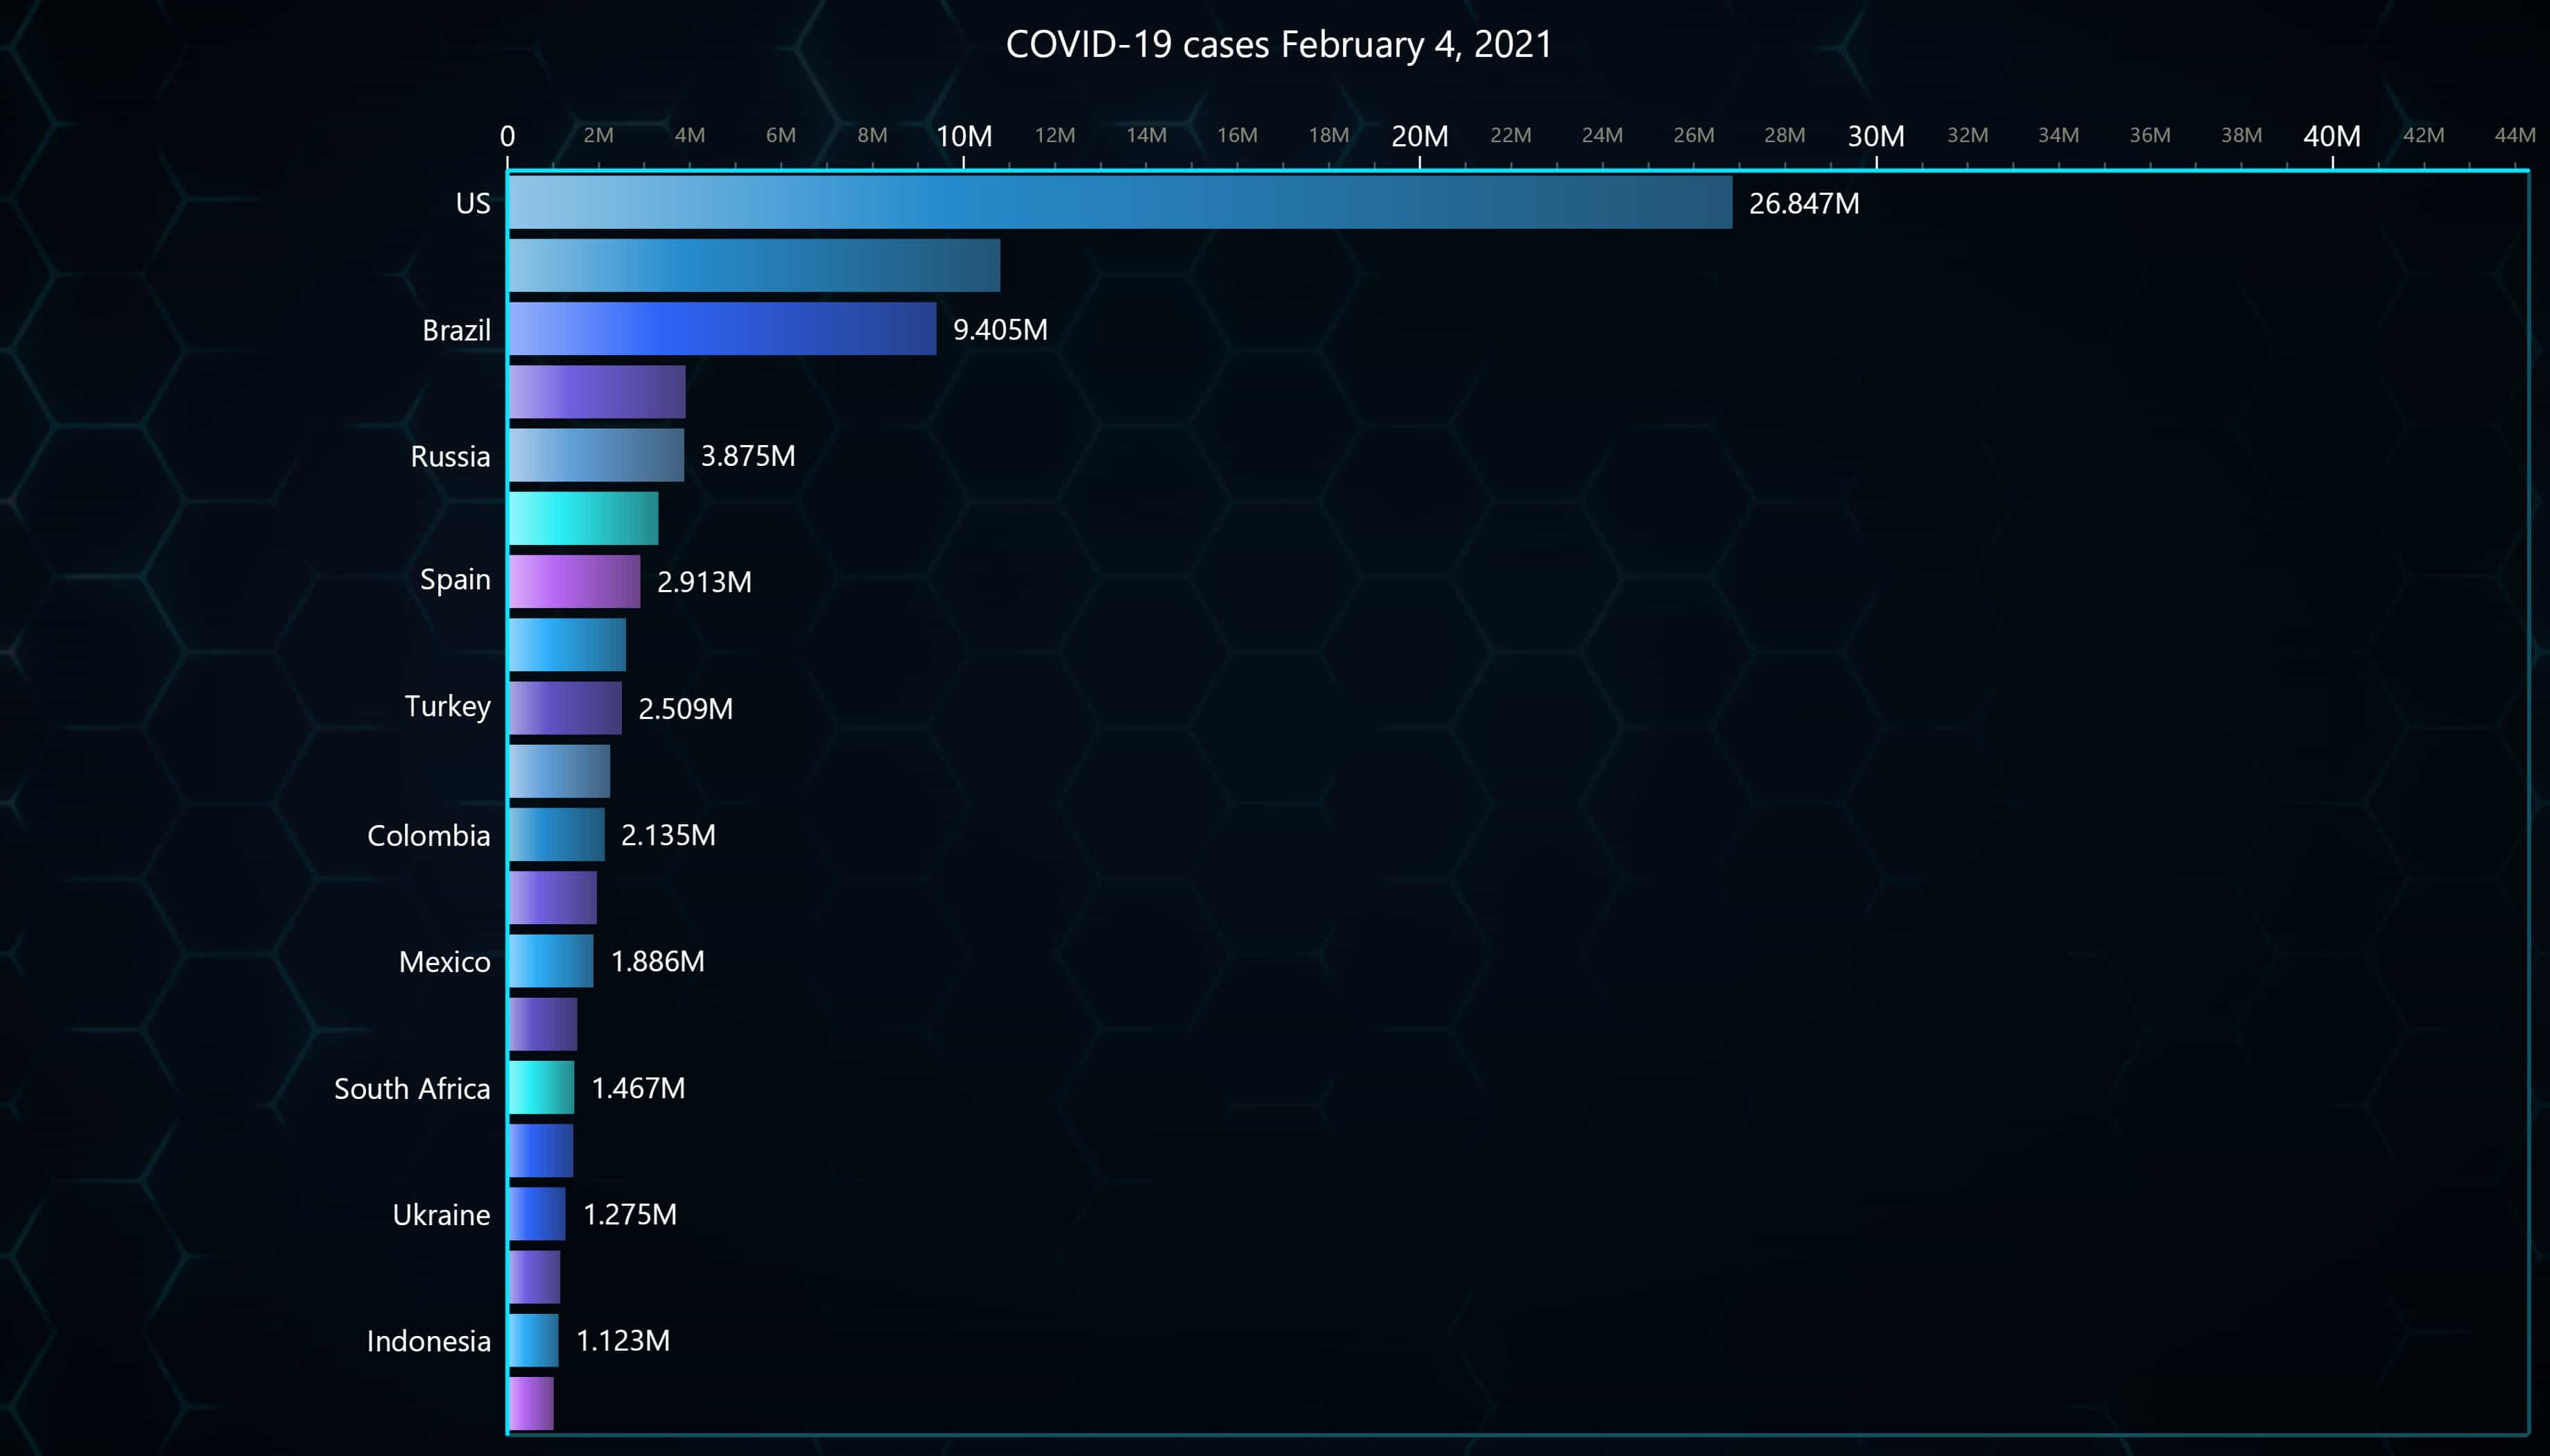
JavaScript Racing Bar Chart
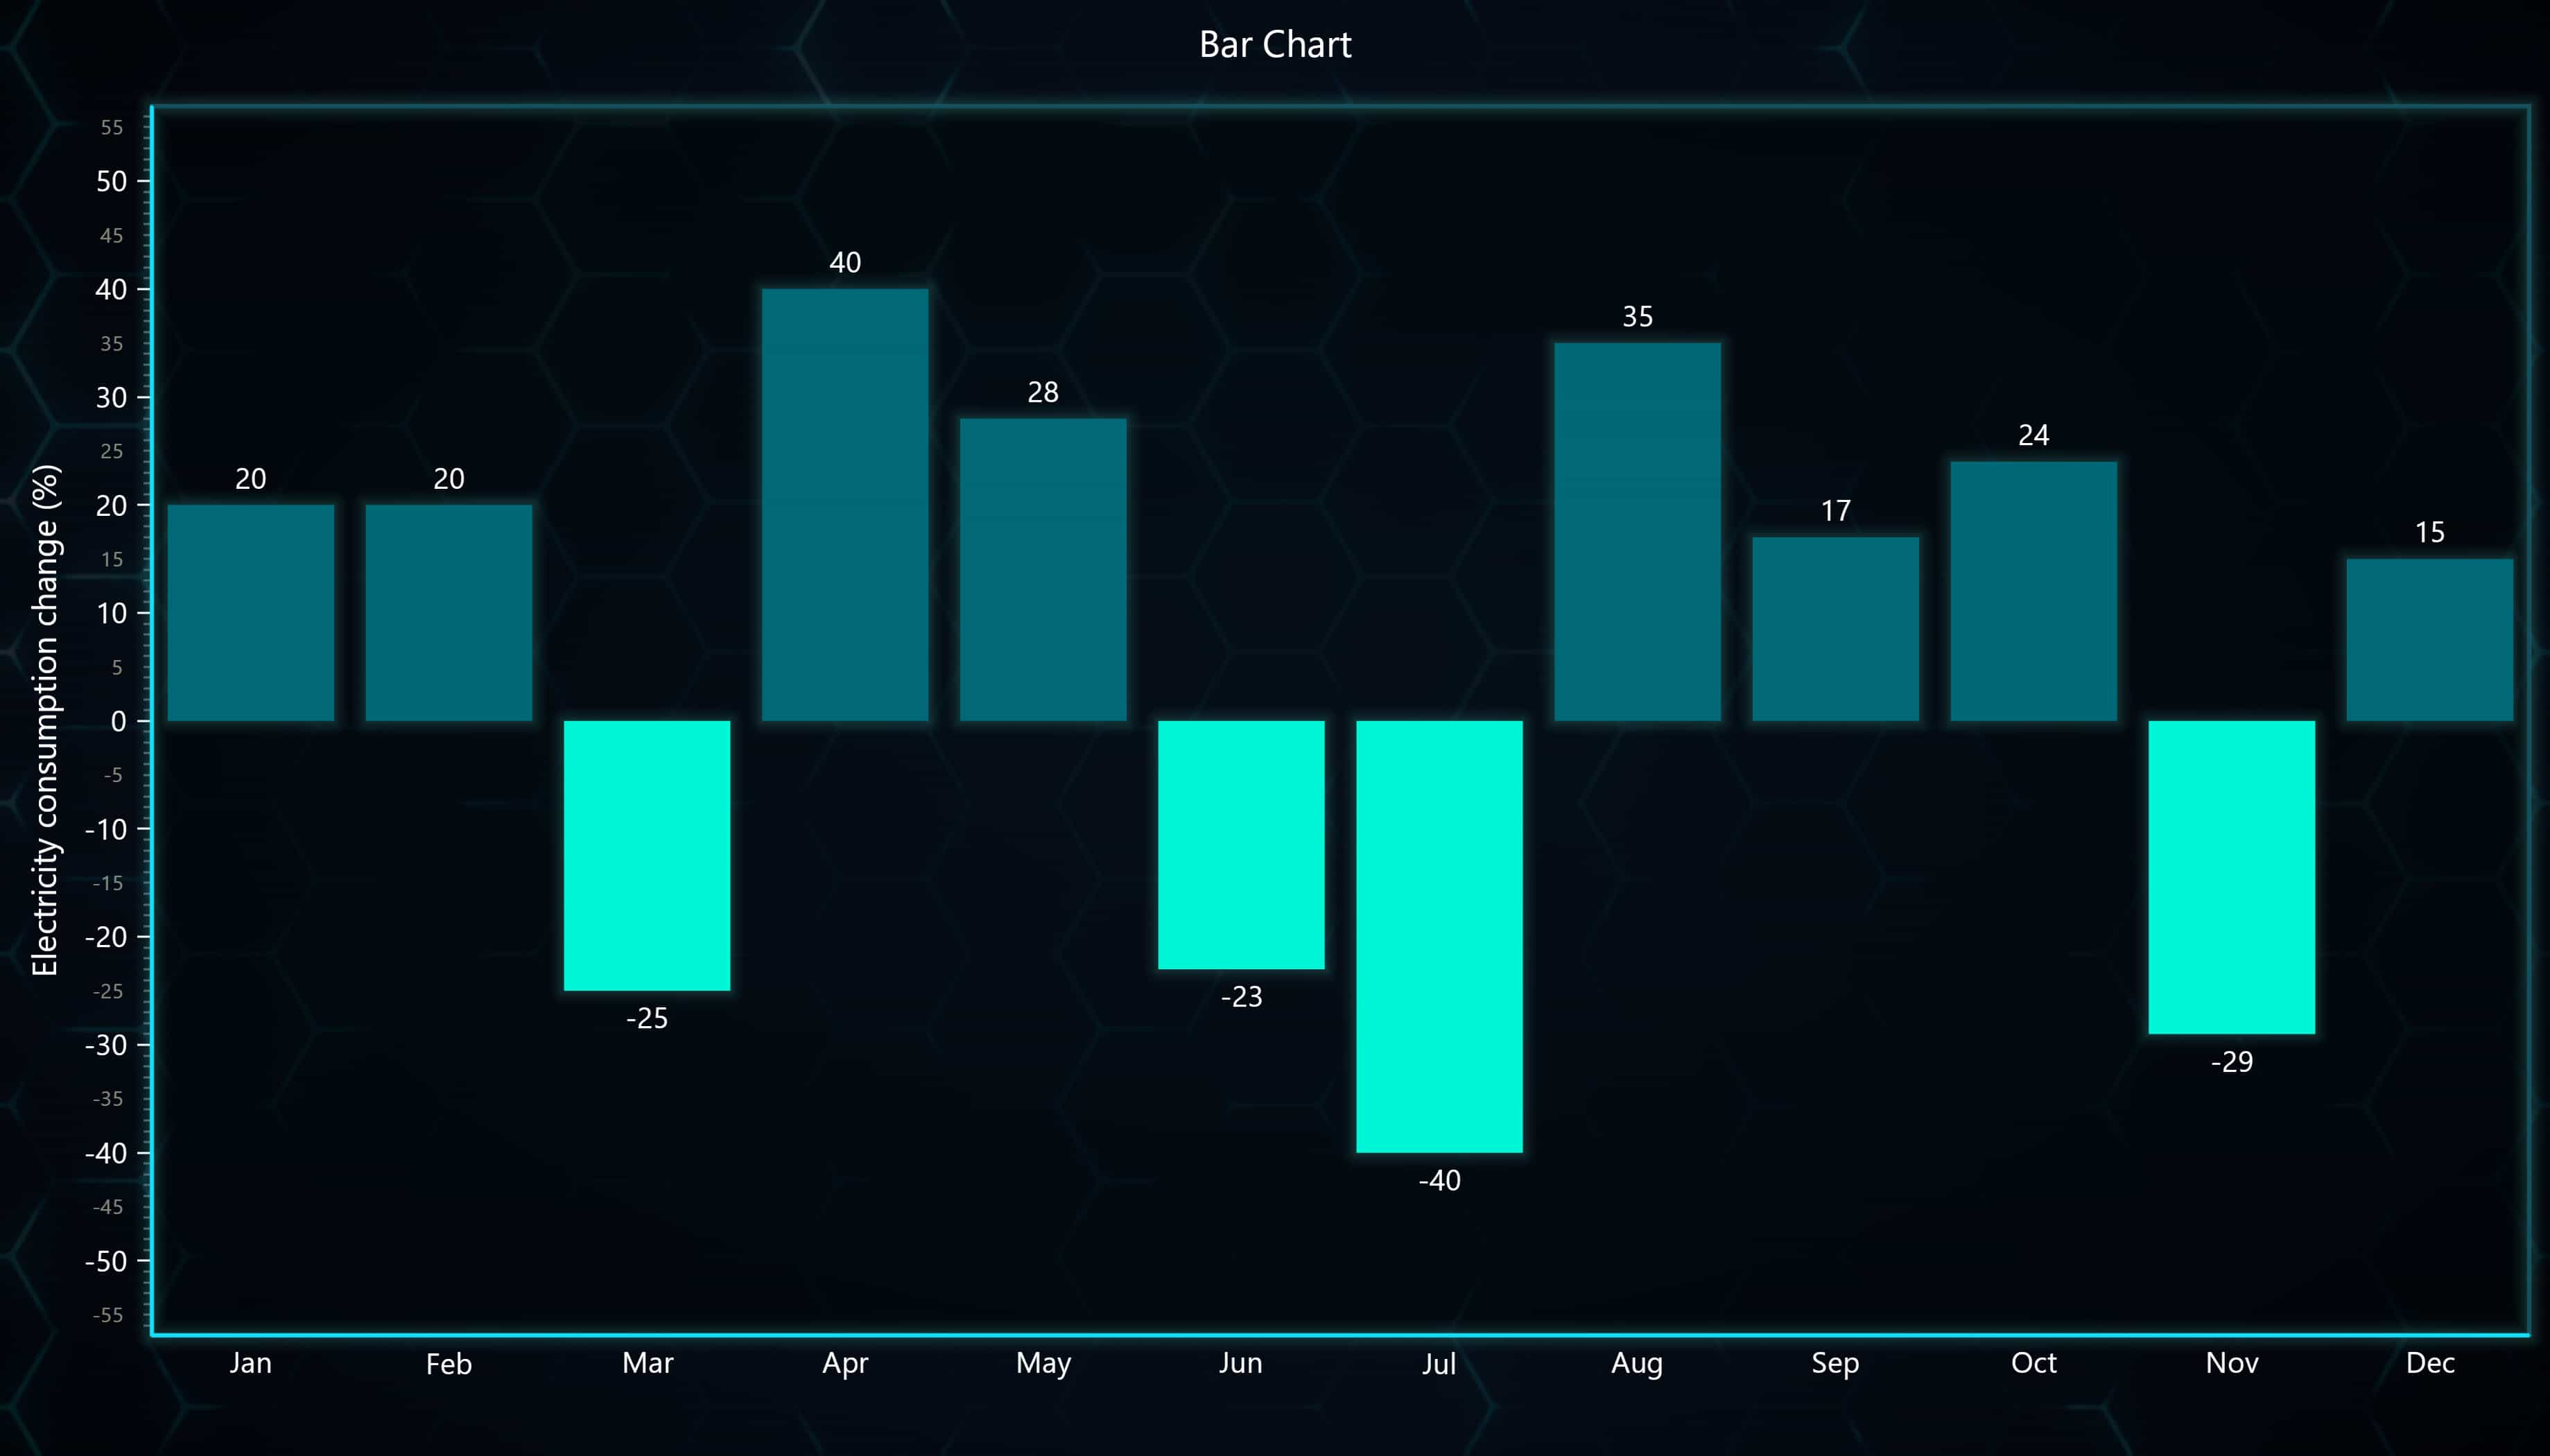
Vertical Bar Chart
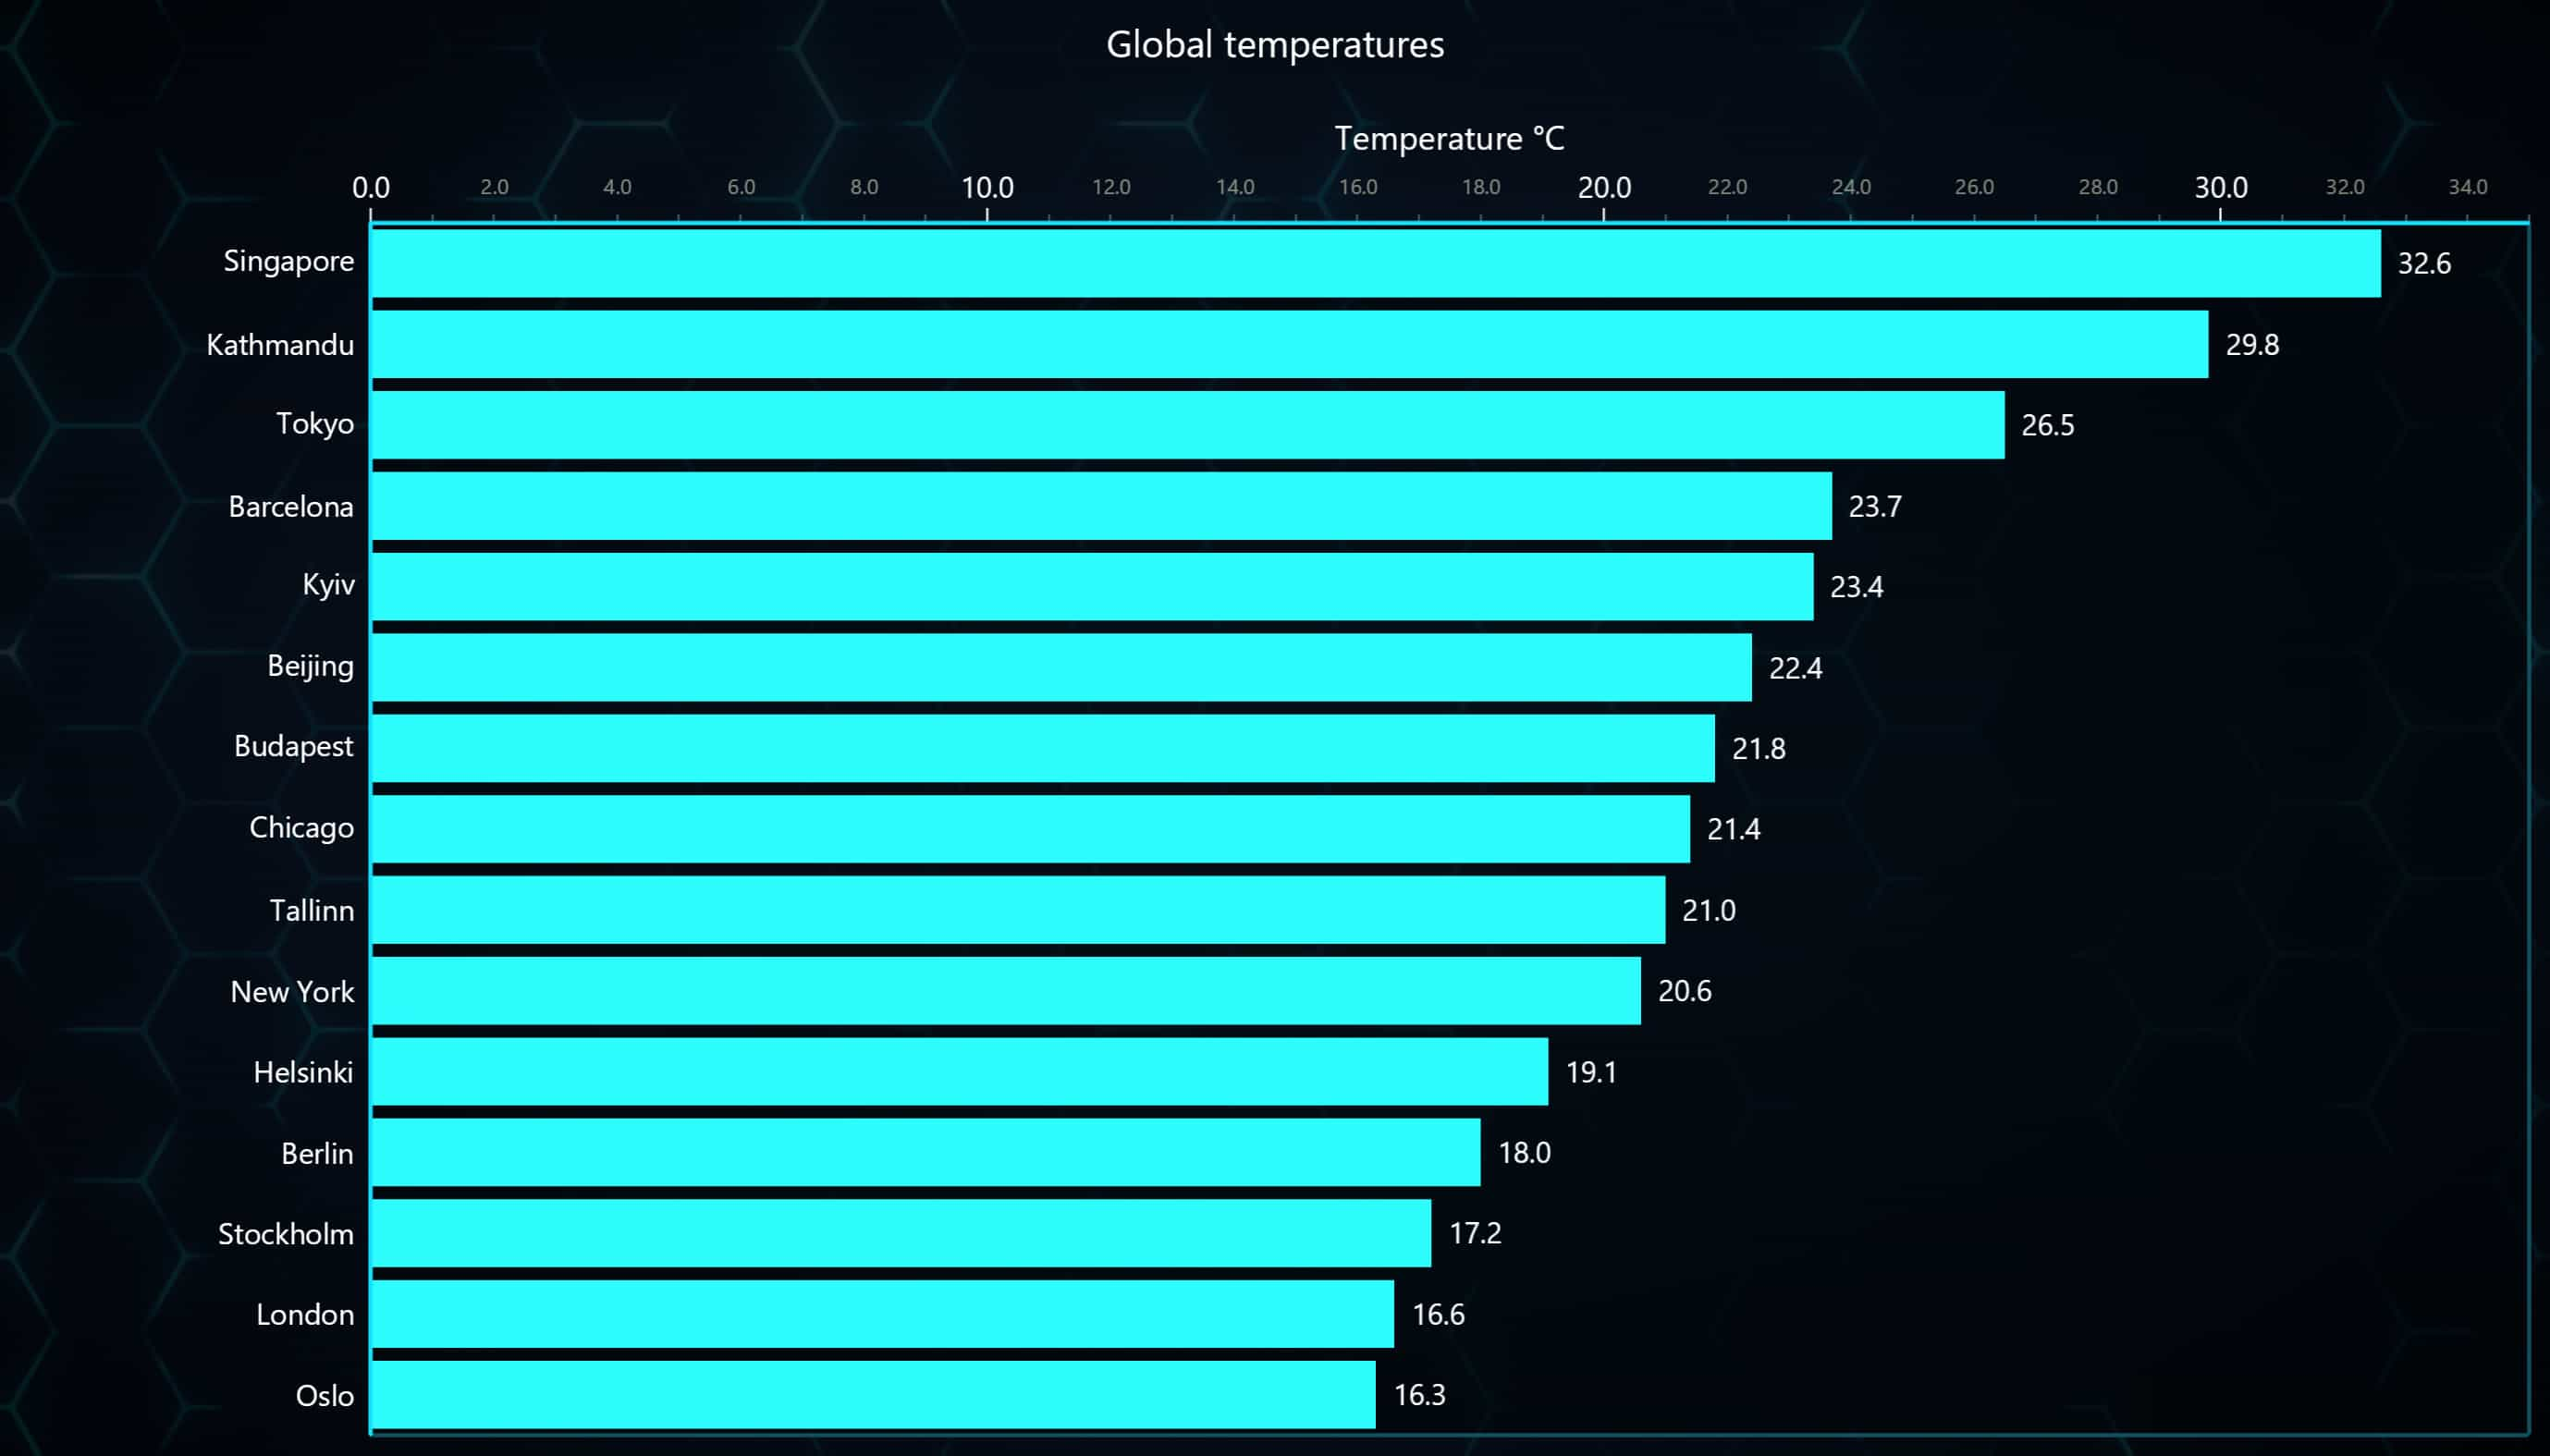
Horizontal Bar Chart of Different Global Temperatures
Coordinate Translations
LightningChart JS v.4.2 introduces coordinate translations: a new API for translating between screen coordinates, even locations, and axis coordinates. This mainly enables a variety of important functions:
- Finds the user’s interactions location along the Axes. For instance, clicking to add a data point.
- Positioning external HTML content at an Axis location. Essentially, this allows you to connect any front-end framework component to LightningChart and its Axes.
const locationAxis = {x: Date.now(), y:0} |
const locationClient = chart.translateCoordinate(locationAxis, chart.axes, chart.client) |
console.log(locationClient) |
// |
chart.onSeriesBackgroundMouseClick((_, event) -> {
|
const locationAxis = chart.translateCoordinate(event, chart.axes) |
console.log(locationAxis) |
}) |
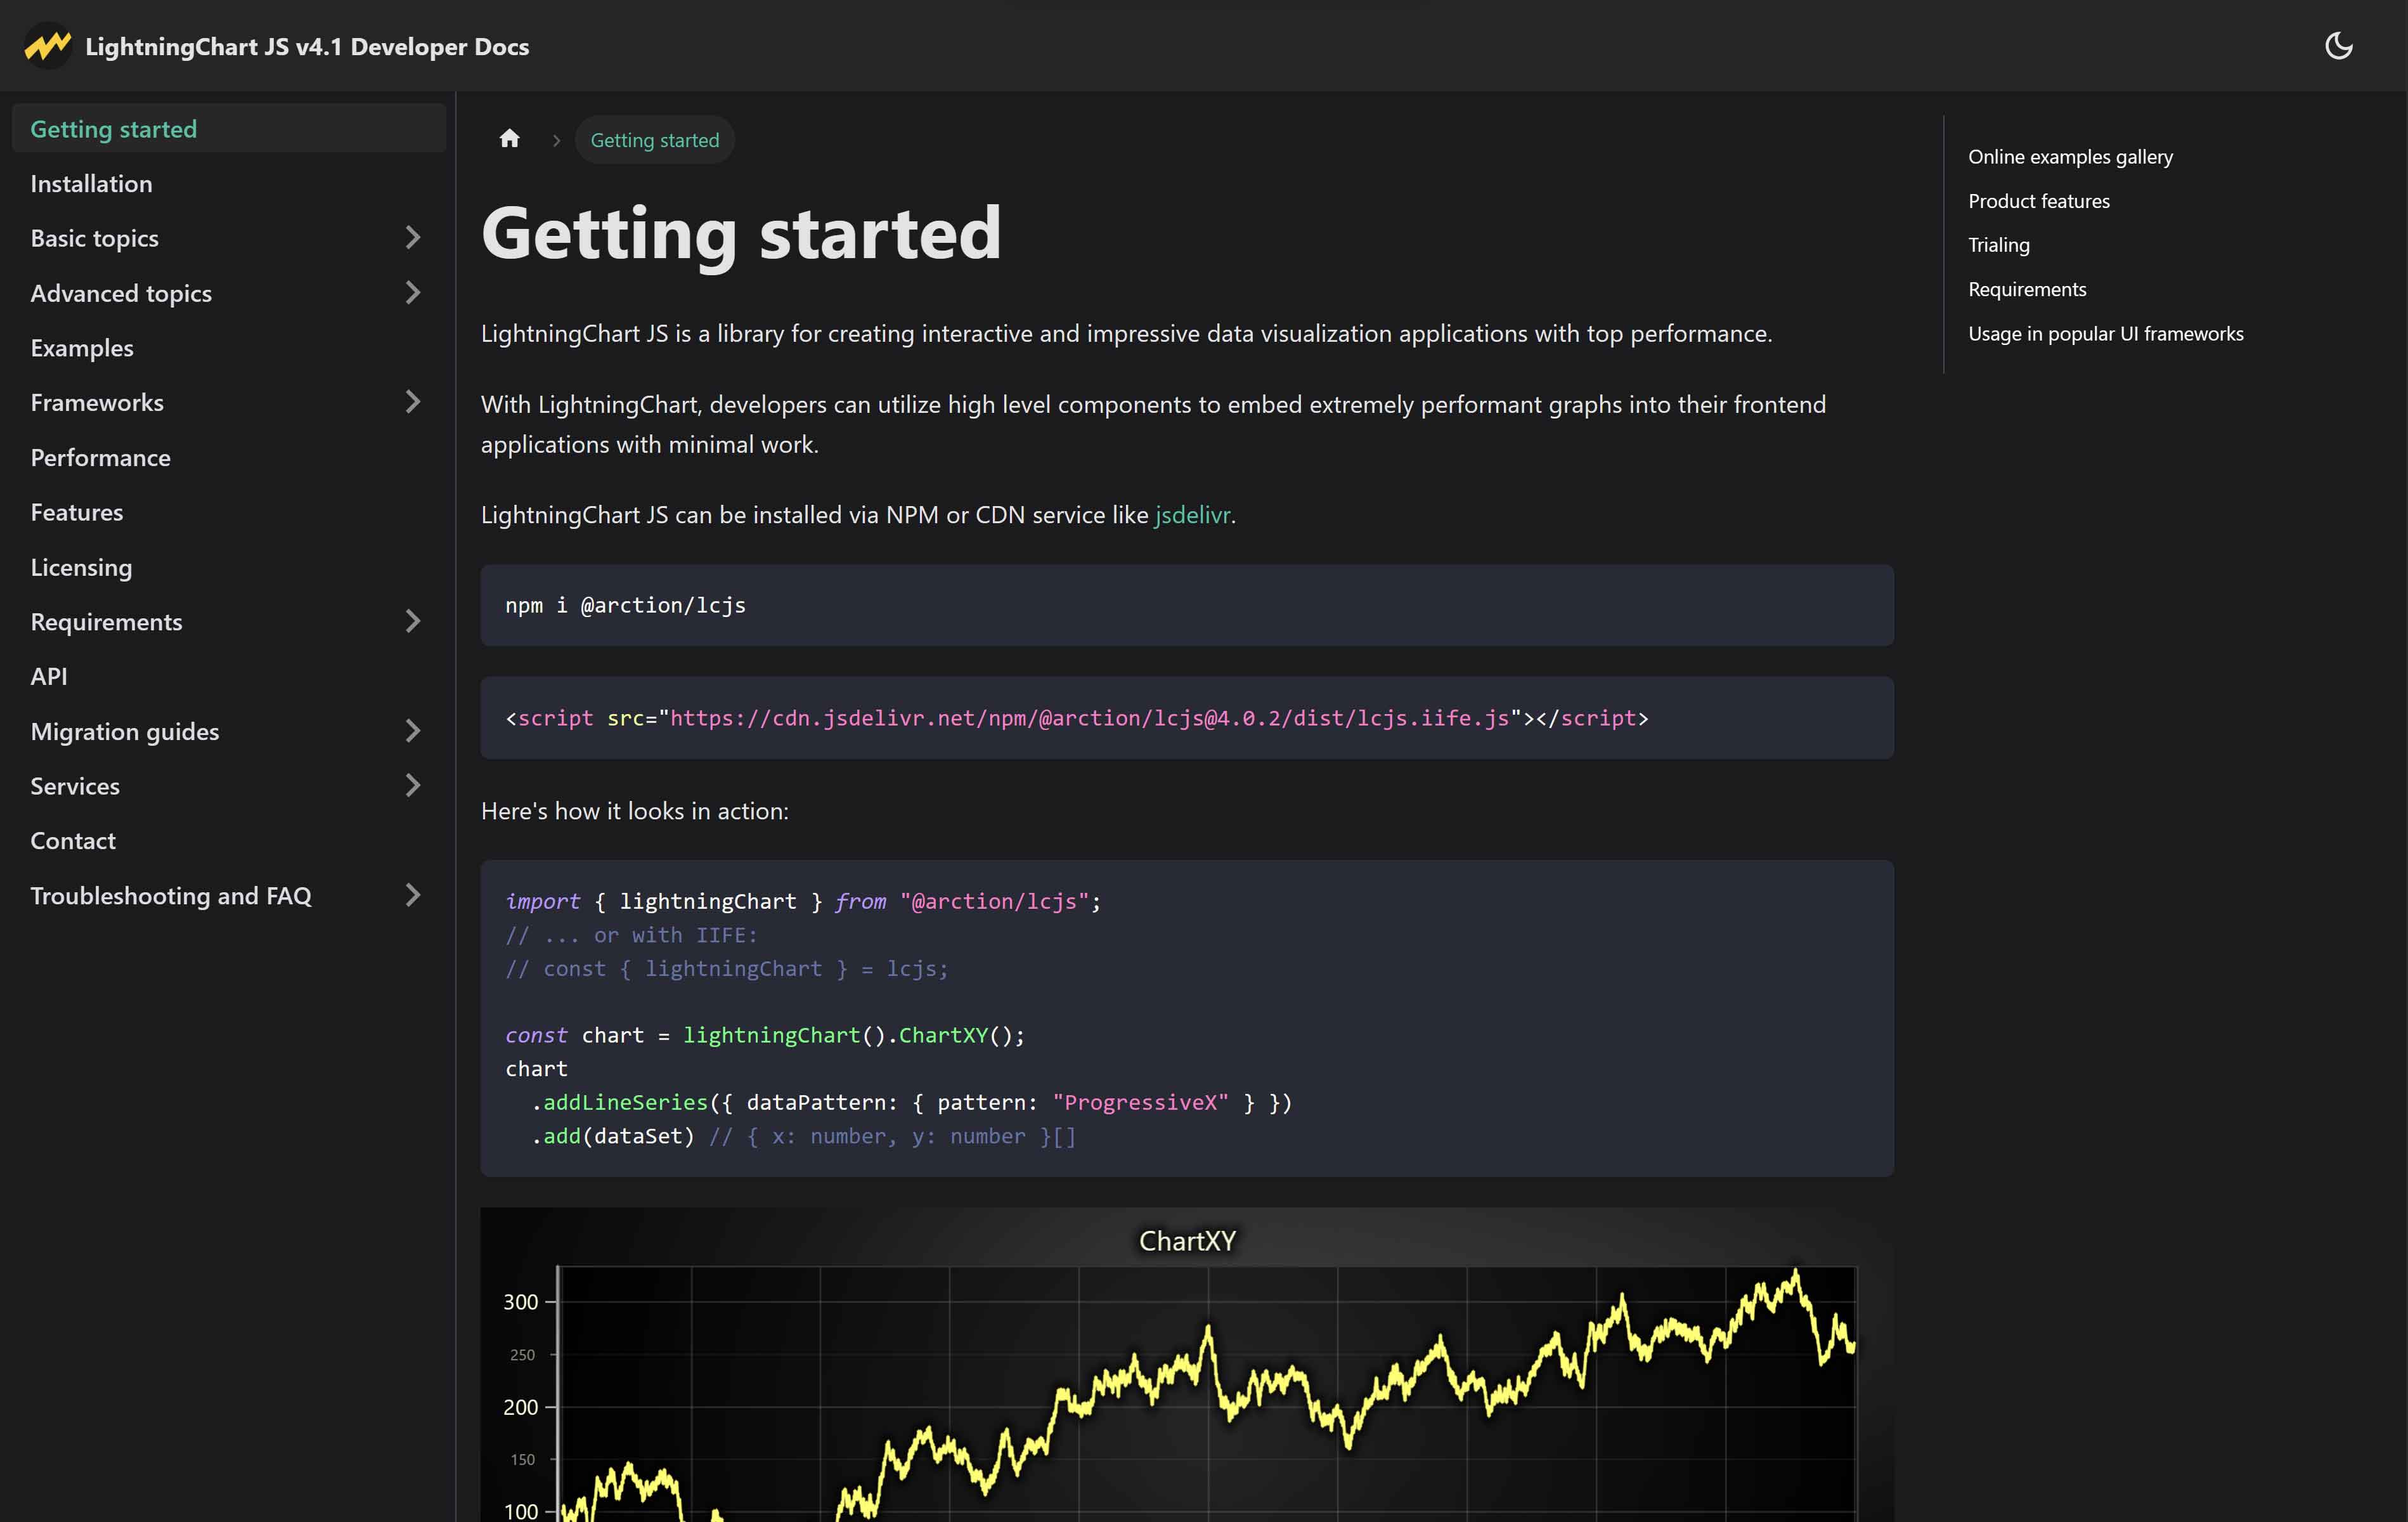
Developer Documentation
For this release, we decided to focus on improving how users learn LightningChart JS. Starting from v.4.2, you can find all developer-oriented instructions, guides, and tutorials in one place: the LightningChart JS Dev Docs. The documentation contains several resources including:
- A Getting Started guide
- Installation guide
- Dedicated guides on over 40 primary and advanced topics