在ionic2开发中,发现这个ionic还不够普及,使用中得探索。今天这个例子是在ionic2中使用图表。由于ionic的库里没有图表库,就和Android原生一样,都得使用第三方库。
本来在前端,就有好多js图表库可以用。因此现在要在angular2上使用第三方库。(ionic2使用angular2开发)。只是,这方面例子少。因此写这篇文章。
一、Angular2使用第三方js插件。
这里参考了文章:https://segmentfault.com/a/1190000005990632
文中提到的方法是:
1. 下载js库。
2. 在index.html文件的head里引入库
3. 在逻辑端,声明这个库在其他地方已经导入(即index.html文件)
declare var Dygraph:any;//声明为外部定义此库。
文章中提到了另一种方式在ionic2工程中我没有成功。接下来就关于导入dygraph.js库作为示例。
在index.html里的<head></head>标签里加入如下。
  <!-- dygraph -->
  <script src="dygraphs/dygraph.js"></script>
  <link href="dygraphs/dygraph.css" rel="stylesheet">
其中,所指定的文件可以到官网下载。
http://dygraphs.com/download.html
二、使用gygraph方法思路来源
思路:在ionic2里面即angular2,我们要使用一个component来封装一下这个dygraph库,然后再调用这个component来使用。(基本思路)
得出这个思路我参考了以下文章:
1.在ionic1即angular1里使用gygraph插件的方法,这个作者实现了一个directive用于打包dygraph.js的库。地址如下:
https://github.com/robotnic/angular-dygraphs
2.在angular2里定义component组件,地址如下:
3. 另一个图表插件的 directive实现,用于ionic1
http://blog.sina.com.cn/s/blog_78a4978e0102wsh7.html
三、编写封装了dygraph的component组件以及使用
首先声明我使用的编程环境及模板:我使用了ionic2的slidmenu模板。打算在page4页面显示一个图表。
第一步:引入js插件
在index.html里的<head></head>标签里加入如下。
  <!-- dygraph -->
  <script src="dygraphs/dygraph.js"></script>
  <link href="dygraphs/dygraph.css" rel="stylesheet">
第二步:定义组件
修改补充:
这里可以不用再index.html 里引入js库文件,可用通过以下方法引入文件:
npm install dygraphs安装完成后,说明文档里会有调用 方法,,其方法如下:(两种)
import Dygraph from 'dygraphs';
// or: const Dygraph = require('dygraphs');
在page4的文件夹下新建一个文件为:mydygraph.ts作为包含dygraph的组件。
在mydygraph.ts文件里写如下内容:import { Component, Input, ViewChild, ElementRef, AfterViewInit } from '@angular/core';
declare var Dygraph:any;//声明为外部定义此库(使用以下的导入,方法,则屏蔽此行,并取消index.html导入的js库文件)
import Dygraph from 'dygraphs';//建议使用这种简单的方法
//import { Dygraph } from 'dygraphs'; //经过测试,这个方法不可用
@Component ({
selector: 'my-dygraph',
template:`
<div>
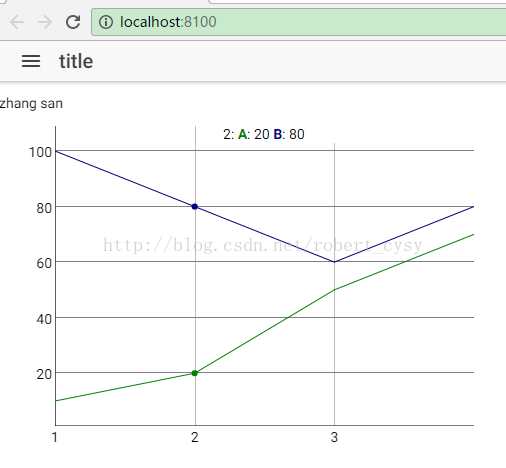
<p>zhang san</p>
<div #graph></div>
</div>
`
})
export class DygraphComponent implements AfterViewInit {
@ViewChild('graph')
elt:ElementRef;
@Input()
title:string;
ngAfterViewInit() {
new Dygraph(this.elt.nativeElement, [
[1,10,100],
[2,20,80],
[3,50,60],
[4,70,80]
],
{
labels: [ "x", "A", "B" ]
});
}
}
这样一个包含dygraph的component就完成了,内容解释如下:
(1) Selector:‘my-dygraph’;的意义是定义了一个标签,这个标签就代表了这个组件(component),要在页面里使用这个组件,只需要在需要的位置包含这个标签就可以。调用的标签写为:<my-dygraph></my-dygraph>。
(2) Template:定义了组件的模板。,及组件内的显示元素。我们在这里定义了dygraph需要使用的标签:<div#graph></div>
(3) 在ngAfterViewInit()函数里面使用dygraph定义,以及传递数据。
最后关于dygraph本来的使用方法,参考:http://dygraphs.com/tutorial.html
第三步:声明组件
在angular2里面,定义的组件需要在module里面声明才可以被认识。声明方法:
在app目录下的app.module.ts文件里面添加如下内容:
导入:
import { DygraphComponent } from '../pages/page4/mydygraph';
声明:在declarations里面增加 DygraphComponent,结果如下。
 declarations: [
    MyApp,
    Page1,
    Page2,
    Page3,
    Page4,
    DygraphComponent
  ],
第四步:使用组件
在page4.html文件里的<ion-content>标签内加入如下内容:
    <div>
       <my-dygraph></my-dygraph>
    </div>
第五步:查看效果
执行命令:ionic serve 在浏览器效果如下: