# -*- coding: utf-8 -*-
"""
Created on Thu Jun 07 09:17:40 2018
@author: yjp
"""
import matplotlib.pyplot as plt
import numpy as np
from matplotlib.ticker import MultipleLocator, FormatStrFormatter
y0 = []
y1 = []
y2 = []
y3 = []
y4 = []
f = open("y0.txt")
lines = f.readlines()
for li in lines:
y0.append(li)
f = open("y1.txt")
lines = f.readlines()
for li in lines:
y1.append(li)
f = open("y2.txt")
lines = f.readlines()
for li in lines:
y2.append(li)
f = open("y3.txt")
lines = f.readlines()
for li in lines:
y3.append(li)
f = open("y4.txt")
lines = f.readlines()
for li in lines:
y4.append(li)
font1 = {'family' : 'Times New Roman',
'weight' : 'normal',
'size' : 9,
}
font2 = {'family' : 'Times New Roman',
'weight' : 'normal',
'size' : 14,
}
figsize = 8, 9
plt.subplots(figsize=figsize) # 设定整张图片大小
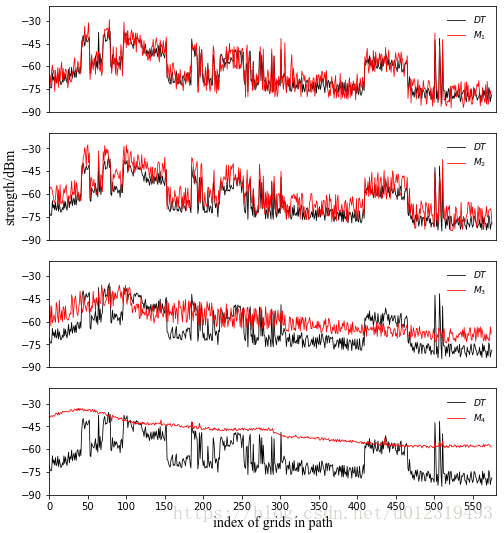
ax1 = plt.subplot(4, 1, 1)
ax1.yaxis.set_major_locator(MultipleLocator(15)) # 设定y轴刻度间距
#第一条线
x = range(0, len(y0))
plt.plot(x, y0, color='black', label='$DT$', linewidth=0.8) # 绘制,指定颜色、标签、线宽,标签采用latex格式
plt.ylim(-90, -20) # 设定y轴范围
hl=plt.legend(loc='upper right', prop=font1, frameon=False) # 绘制图例,指定图例位置
#set(hl,'Box','off');
#第二条曲线
x = range(0, len(y1))
plt.plot(x, y1, color='red', label='$M_1$', linewidth=0.8)
plt.legend(loc='upper right', prop=font1, frameon=False) # 绘制图例,指定图例位置
plt.xticks([]) # 去掉x坐标轴刻度
plt.xlim(0, 580) # 设定x轴范围
ax2 = plt.subplot(4, 1, 2)
ax2.yaxis.set_major_locator(MultipleLocator(15))
x = range(0, len(y0))
plt.plot(x, y0, color='black', label='$DT$', linewidth=0.8)
plt.ylim(-90, -20)
hl=plt.legend(loc='upper right', prop=font1, frameon=False)
#set(hl,'Box','off');
x = range(0, len(y2))
plt.plot(x, y2, color='red', label='$M_2$', linewidth=0.8)
plt.legend(loc='upper right', prop=font1, frameon=False)
plt.ylabel("strength/dBm", font2)
plt.xticks([])
plt.xlim(0, 580)
ax3 = plt.subplot(4, 1, 3)
ax3.yaxis.set_major_locator(MultipleLocator(15))
x = range(0, len(y0))
plt.plot(x, y0, color='black', label='$DT$', linewidth=0.8)
hl=plt.legend(loc='upper right', prop=font1, frameon=False)
#set(hl,'Box','off');
plt.ylim(-90, -20)
x = range(0, len(y3))
plt.plot(x, y3, color='red', label='$M_3$', linewidth=0.8)
plt.legend(loc='upper right', prop=font1, frameon=False)
plt.xticks([])
plt.xlim(0, 580)
ax4 = plt.subplot(4, 1, 4)
ax4.yaxis.set_major_locator(MultipleLocator(15))
ax4.xaxis.set_major_locator(MultipleLocator(50))
x = range(0, len(y0))
plt.plot(x, y0, color='black', label='$DT$', linewidth=0.8)
plt.ylim(-90, -20)
hl=plt.legend(loc='upper right', prop=font1, frameon=False)
#set(hl,'Box','off');
x = range(0, len(y4))
plt.plot(x, y4, color='red', label='$M_4$', linewidth=0.8)
plt.legend(loc='upper right', prop=font1, frameon=False)
plt.xlabel("index of grids in path", font2)
plt.xlim(0, 580)
plt.savefig("1.png", dpi=600))
plt.show()
python---将多条曲线画在一幅图
猜你喜欢
转载自blog.csdn.net/u012319493/article/details/80609905
今日推荐
周排行