一、安装Prometheus
1、下载最新版Prometheus:
https://prometheus.io/download/
2、解压文件
tar xvfz prometheus-*.tar.gzcd prometheus-*
3、启动服务(用默认配置文件)
./prometheus --config.file=prometheus.yml
4、浏览器访问
5、修改配置文件增加数据收集 export
vi prometheus.yml
在scrape_configs下增加 job
scrape_configs:
  # The job name is added as a label `job=<job_name>` to any timeseries scraped from this config.
  - job_name: 'prometheus'

    # metrics_path defaults to '/metrics'
    # scheme defaults to 'http'.

    static_configs:
      - targets: ['localhost:9090']

  - job_name: 'my_demo'

    # metrics_path defaults to '/metrics'
    # scheme defaults to 'http'.

# 增加监听的 IP 端口,稍后用Python起一个http服务
    static_configs:
      - targets: ['10.10.10.10:9091']
6、Python3 客户端, 启动一个http服务
安装 prometheus_client
pip install prometheus_client
from prometheus_client import start_http_server, Gauge
import time
import random

start_http_server(9091)
g = Gauge('name', 'lable', '')

while True:
    g.set(random.random())
    time.sleep(5)
二、配置 grafana 显示图表
1、安装 启动查看官网Ubuntu安装说明
安装
wget https://s3-us-west-2.amazonaws.com/grafana-releases/release/grafana_5.1.2_amd64.deb
sudo apt-get install -y adduser libfontconfig
sudo dpkg -i grafana_5.1.2_amd64.deb
启动服务
sudo service grafana-server start访问 frafana
http://serverip:3000
2、配置 prometheus数据源
进入configuration DataSource
添加一个DataSource
Tpye 选择Prometheus
url输入Prometheus 的IP 端口
保存并测试
3、新建 DashBoard 并编辑
输入Prometheus 查询语句
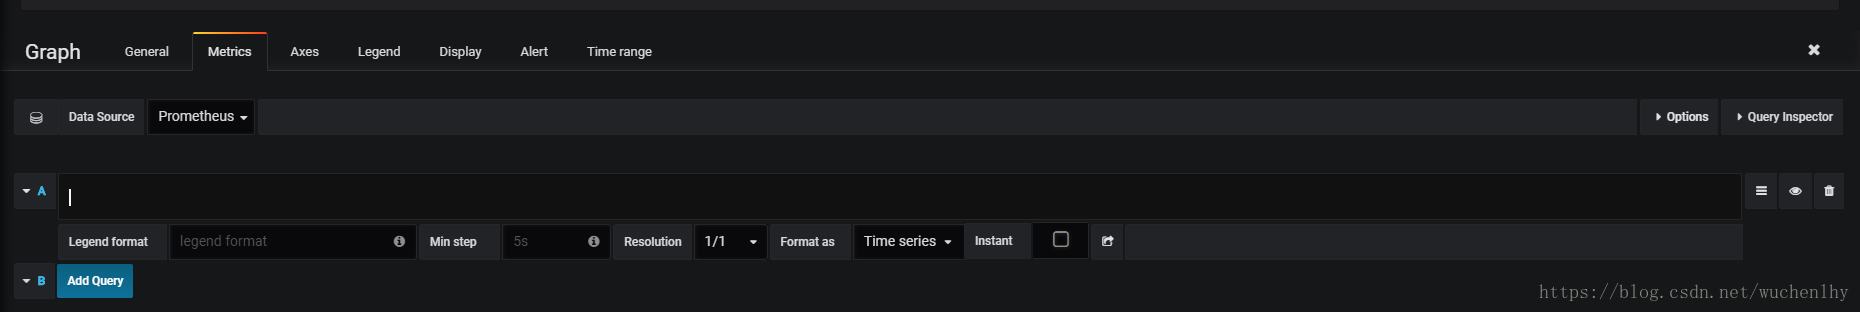
类似于这样的结构
数据名字{instance="job 监听的ip 和端口",job="job_name"}
test_date{instance="10.10.10.10:9091",job="my_demo"}
到这里数据就可以实时显示在grafana上了,如果需要更强大的图表功能还需要下载插件