1 软件环境说明
本次安装部署所用的软件均为官网上目前的最新版本。
操作系统 |
软件 |
Java环境 |
windows 10 |
logstash-6.2.4 |
jdk 1.8.0_171 |
filebeat-6.3.0 |
1.1 filebeat安装(注意:先配置好文件后不要启动,需要先启动logstash,否则输出连接不上会报错)
a. 解压filebeat--6.3.0.zip到自定义路径下
b. 进入filebeat文件夹,找到filebeat.yml,对其进行输入输出配置;
其中,输入配置如下:(注意,enable应配置为true,让配置文件生效,路径指向你要搜集的日志路径,可以配多个)
#=========================== Filebeat inputs =============================

filebeat.inputs:

# Each - is an input. Most options can be set at the input level, so
# you can use different inputs for various configurations.
# Below are the input specific configurations.

- type: log

  # Change to   true to enable this input configuration.
  enabled: true

  # Paths that should be crawled and fetched. Glob based paths.
  paths:
    - D:\APP_Center\workspace\eclipse\ELK_Log\log\*.log
    #- /var/log/*.log
    #- c:\programdata\elasticsearch\logs\*
输出配置如下:(将默认的elasticsearch输出注释掉,重新配置logstash,其他配置均为默认即可)
#----------------------------- Logstash output --------------------------------
output.logstash:
  # The Logstash hosts
  hosts: ["127.0.0.1:5044"]
1.2 Logstash安装
a. 解压logstash-6.2.4.zip到自定义路径下;
b. 进入bin目录下,新定义一个配置文件:logstash-simple.conf(名称可自定义),输入来自filebeat,这里采取最简单的标准输出;
input {
	beats{
		host => "127.0.0.1"
		port => 5044
		type => "log4j"
	}
}
output {
stdout{
codec => rubydebug
}
}1.3 启动
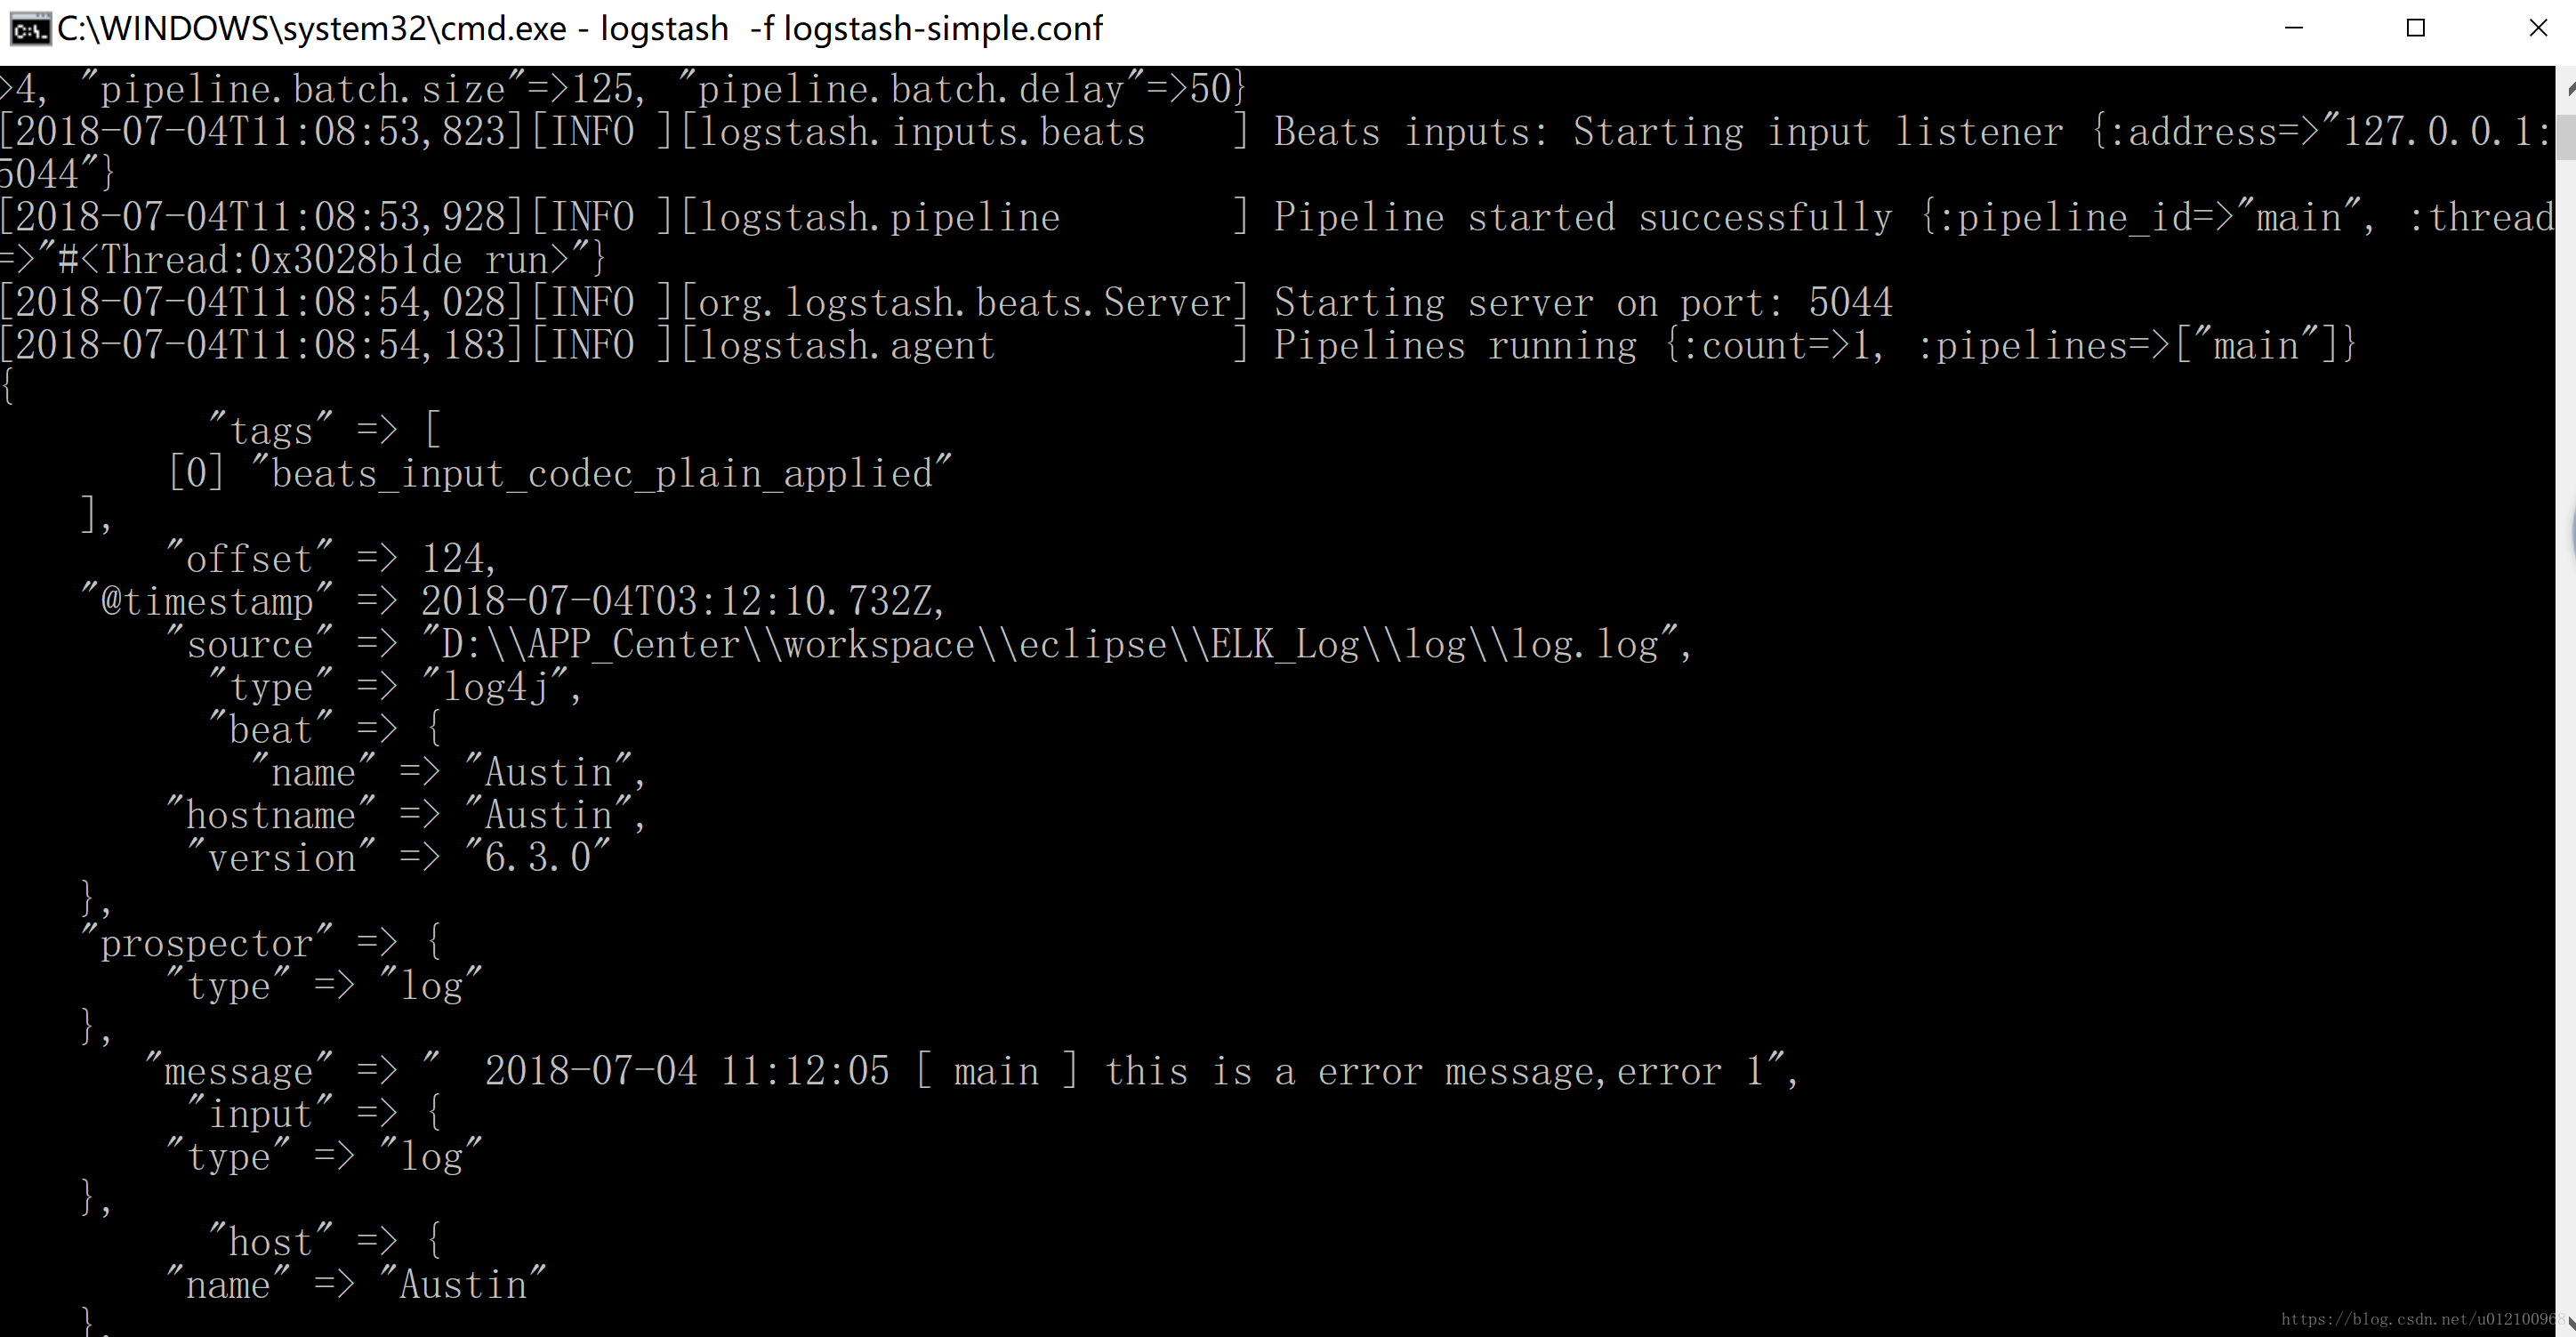
a. 先启动logstash , 进入windows的cmd窗口,使用命令进入配置文件所在的bin目录,启动logstash;
logstash –f logstash-simple.conf看到如下输出,则代表启动成功。
Sending Logstash's logs to D:/logstash-6.2.4/logs which is now configured via log4j2.properties
[2018-07-04T11:08:37,244][INFO ][logstash.modules.scaffold] Initializing module {:module_name=>"fb_apache", :directory=>"D:/logstash-6.2.4/modules/fb_apache/configuration"}
[2018-07-04T11:08:37,279][INFO ][logstash.modules.scaffold] Initializing module {:module_name=>"netflow", :directory=>"D:/logstash-6.2.4/modules/netflow/configuration"}
[2018-07-04T11:08:37,565][WARN ][logstash.config.source.multilocal] Ignoring the 'pipelines.yml' file because modules or command line options are specified
[2018-07-04T11:08:38,413][INFO ][logstash.runner          ] Starting Logstash {"logstash.version"=>"6.2.4"}
[2018-07-04T11:08:39,318][INFO ][logstash.agent           ] Successfully started Logstash API endpoint {:port=>9600}
[2018-07-04T11:08:51,885][INFO ][logstash.pipeline        ] Starting pipeline {:pipeline_id=>"main", "pipeline.workers"=>4, "pipeline.batch.size"=>125, "pipeline.batch.delay"=>50}
[2018-07-04T11:08:53,823][INFO ][logstash.inputs.beats    ] Beats inputs: Starting input listener {:address=>"127.0.0.1:5044"}
[2018-07-04T11:08:53,928][INFO ][logstash.pipeline        ] Pipeline started successfully {:pipeline_id=>"main", :thread=>"#<Thread:0x3028b1de run>"}
[2018-07-04T11:08:54,028][INFO ][org.logstash.beats.Server] Starting server on port: 5044
[2018-07-04T11:08:54,183][INFO ][logstash.agent           ] Pipelines running {:count=>1, :pipelines=>["main"]}
b. 再启动filebeat,进入windows的cmd窗口,再进入对应的路径,输入启动命令:(也可以同时按住Ctrl+shift再右键打开powershell窗口)
filebeat.exe -e -c filebeat.yml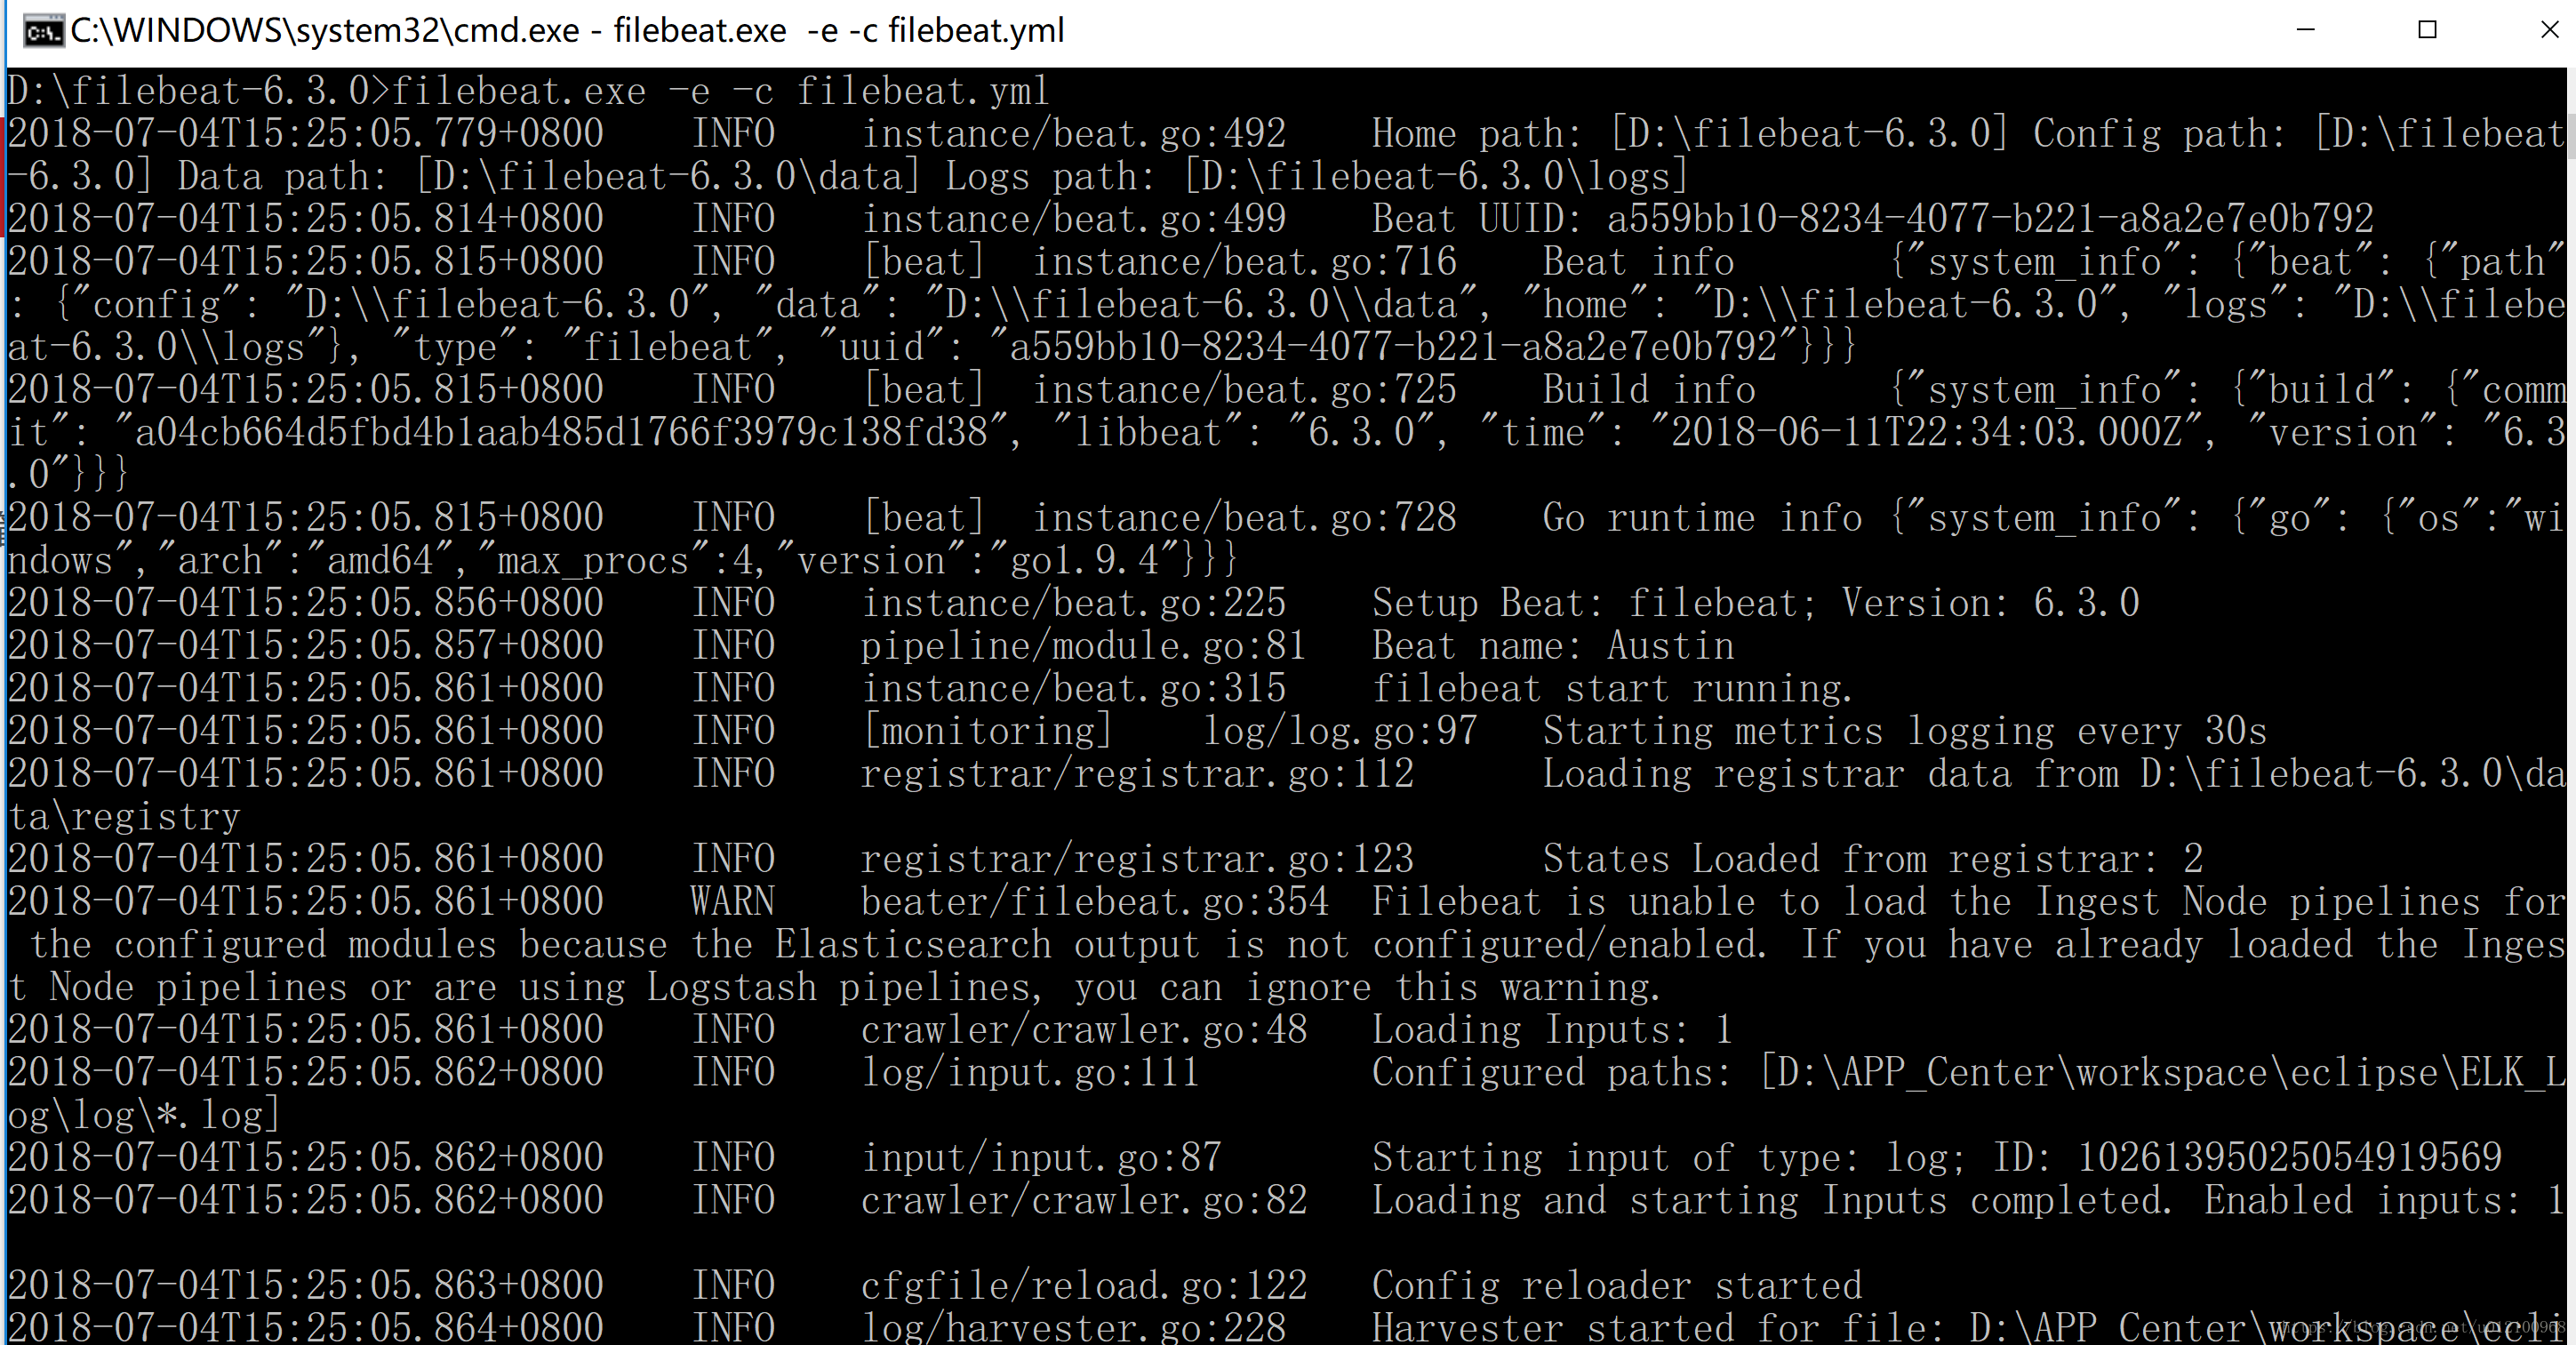
3. 如果产生日志时,logstash就会有标准输出。