MATLAB如何画三轴图
前言
使用MATLAB绘图非常方便,它提供了非常丰富的图形,如:line,bar,stem等,用户可以直接调用相应的函数,但有时直接使用这些“高级”的函数不能满足我们的绘图要求,比如,如何绘制三Y轴的图形?,即一个figure中有一个X轴,三个Y轴,分别对应三个数据曲线(line或bar等),比如下图:

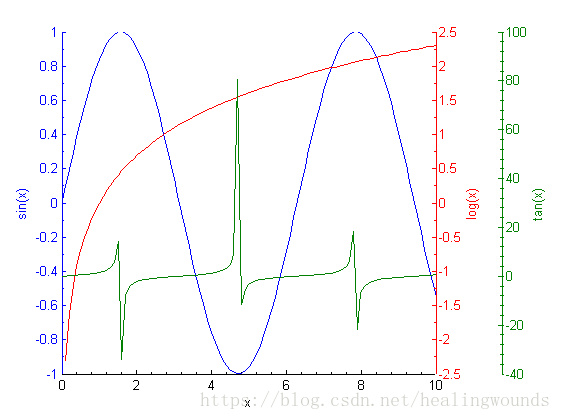
绘制这些图的技巧就是学会操纵对象句柄,掌握了方法之后可以非常灵活的绘制各种你想要的图形。
下面我以第一幅图像为例,介绍它的画法。
目录
1. 预备知识
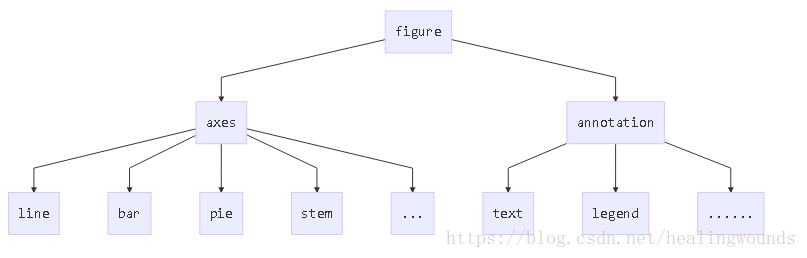
MATLAB绘图实际上是在创建一些资源对象,这里的对象包括:图(figure)、轴(axes)、线(line)、柱状图(bar)以及其他标注对象(如文字(text)、图例(legend)等)等。这些对象各自都与唯一的一个句柄(handle)想关联。对象创建之后,通过 get(handle, ‘property name’) 获取对象指定的属性值,通过set(handle, ‘property name’, ‘property value’) 设置属性值。它们之间有一定的所属关系,如下图
2. 创建数据,并建一个figure
% 第一个bar的数据
x1=0:.5:10;
y1=sin(x1);
% 第二个line的数据
x2=0:.1:10;
y2=log(x2);
% 第三个line的数据
x3=x2;
y3 = tan(x3);
figure;
3. 画第一个bar
% 建第一个axes
ha(1) = axes('ycolor','b','yminortick','on','xminortick','off');
hold on; % 保持以上属性,因为下面的bar有自动调整axes属性的作用
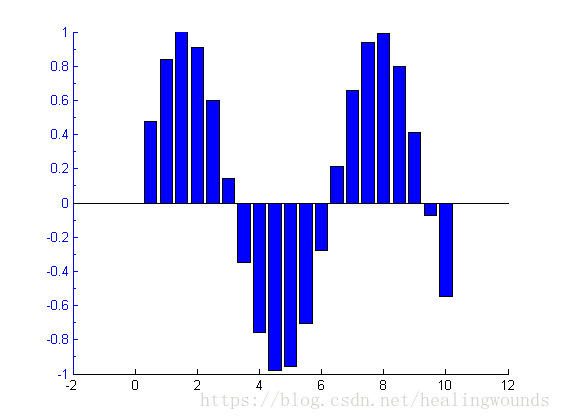
h(1) = bar(x1, y1,'parent',ha(1),'facecolor','b'); % 画第一个bar图
xlim1 = get(ha(1),'xlim'); % 获取第一个axes的x轴的范围,这个值很关键得到如下图:
4. 画第二个线
% 建立第二个轴,要与第一个轴重合,并且透明,轴的范围相同
pos1=get(ha(1),'position');
ha(2) = axes('position',pos1,'color','none','ycolor','r','yaxislocation','right','xlim',xlim1, ... 'xtick', []);

% 画线
h(2) = line(x2,y2,'color','r','parent',ha(2),'linewidth',1.2,'linestyle','-');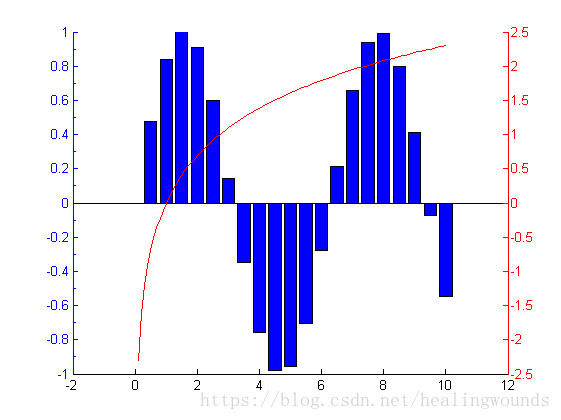
5. 画第三个线图
% 建立第三个轴,左侧与前两个轴对齐,右侧要长出一部分,因此该轴的范围要比前轴的范围大,根据范围与轴的长度成正 % 比来计算
pos1(1)=pos1(1)-0.02;
pos1(3) = pos1(3)*.86;
set([ha(1);ha(2)],'position',pos1);
pos3 = pos1;
pos3(3) = pos3(3)+.12;
xlim3 = xlim1;
xlim3(2) = xlim3(1)+(xlim1(2)-xlim1(1))/pos1(3)*pos3(3);
ha(3) = axes('position',pos3, 'color','none','ycolor',[0,0.5,0],'xlim',xlim3, ...
    'xtick',[],'yaxislocation','right','yminortick','on');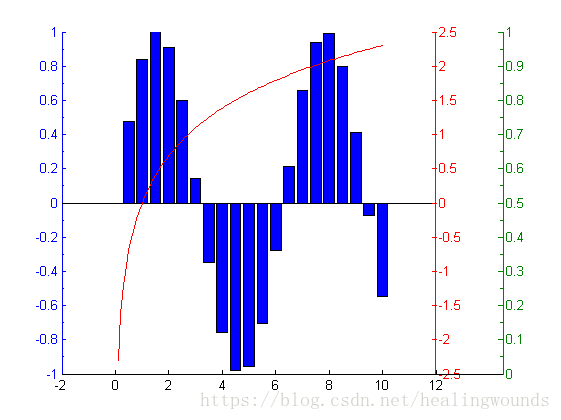
% 截去多余数据点,并画线
[x3, ind] = sort(x3, 2, 'ascend');
y3 = y3(ind);
ind2 =  (x3<=xlim1(2));
y3 = y3(ind2);
x3 = x3(ind2);
h(3) = line(x3, y3,'color',[0,.5,0],'linewidth',1.2,'linestyle','-','parent',ha(3));
% 隐藏第三个横轴伸出来的部分
ylim3 = get(ha(3), 'ylim');
line([xlim1(2),xlim3(2)],[ylim3(1),ylim3(1)],'parent',ha(3),'color','w');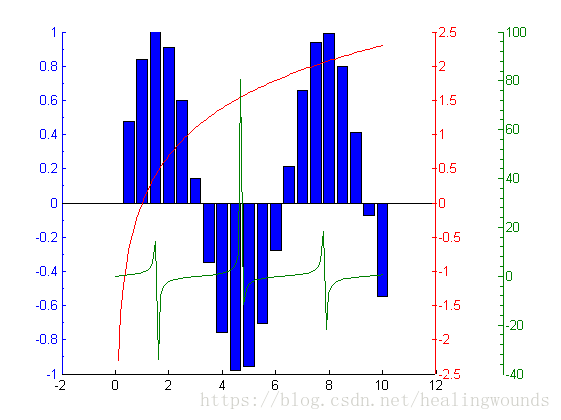
6. 加label
% 加ylabel
hylab = get([ha(1);ha(2);ha(3)],'ylabel');
hxlab = get(ha(1),'xlabel');
set(hylab{1},'string','bar');
set(hylab{2},'string','log(x)');
set(hylab{3},'string','tan(x)');
% 加xlabel
set(hxlab,'string', 'x');
最终,如上面第一个图所示。
7. 封装成函数
为了今后方便调用,编写成函数如下:
function [ha, h] = barplotplot(x1,y1,x2,y2,x3,y3,xlim1, xlab, ylab)
% [ha, h] = barplot(x1,y1,x2,y2,x3,y3,xlim1, xlab, ylab)

ha(1) = axes('ycolor','b','yminortick','on','xminortick','off');
hold on;
h(1) = bar(x1, y1,'parent',ha(1),'facecolor','b');
if ~isempty(xlim1)
    set(ha(1), 'xlim', xlim1);
end
xlim1 = get(ha(1),'xlim');

% 画第二条线
pos1=get(ha(1),'position');
ha(2) = axes('position',pos1,'color','none','ycolor','r','yaxislocation','right','xlim',xlim1, ... 'xtick', []);

h(2) = line(x2,y2,'color','r','parent',ha(2),'linewidth',1.2,'linestyle','-');

% 画第三条线
pos1(1)=pos1(1)-0.02;
pos1(3) = pos1(3)*.86;
set([ha(1);ha(2)],'position',pos1);
pos3 = pos1;
pos3(3) = pos3(3)+.12;
xlim3 = xlim1;
xlim3(2) = xlim3(1)+(xlim1(2)-xlim1(1))/pos1(3)*pos3(3);
ha(3) = axes('position',pos3, 'color','none','ycolor',[0,0.5,0],'xlim',xlim3, ...
    'xtick',[],'yaxislocation','right','yminortick','on');
% 截取多余部分
[x3, ind] = sort(x3, 2, 'ascend');
y3 = y3(ind);
ind2 =  (x3<=xlim1(2));
y3 = y3(ind2);
x3 = x3(ind2);
h(3) = line(x3, y3,'color',[0,.5,0],'linewidth',1.2,'linestyle','-','parent',ha(3));
% 隐藏多余的轴
ylim3 = get(ha(3), 'ylim');
line([xlim1(2),xlim3(2)],[ylim3(1),ylim3(1)],'parent',ha(3),'color','w');

if nargin == 7; return; end
% 加ylabels
hylab = get([ha(1);ha(2);ha(3)],'ylabel');
hxlab = get(ha(1),'xlabel');
set(hylab{1},'string',ylab{1});
set(hylab{2},'string',ylab{2});
set(hylab{3},'string',ylab{3});
set(hxlab,'string', xlab);
hold off;
end
调用时执行:
% 第一个bar的数据
x1=0:.5:10;
y1=sin(x1);
% 第二个line的数据
x2=0:.1:10;
y2=log(x2);
% 第三个line的数据
x3=x2;
y3 = tan(x3);
[ha,h] = barplotplot(x1,y1,x2,y2,x3,y3,[],{'x'},{'sin(x)','log(x)','tan(x)'}); % xlim可以指定, % 为[]表示采用默认值
8. 常用绘图对象属性表
1 Axes常用的属性
Box ‘on’(default) , ‘off’
GridLineStyle ‘-’ ‘:’ ‘-.’ ‘none’
LineStyleOrder LineSpec
LineWidth .5(default)
TickDir ‘in’(default), ‘out’
TickDirMode ‘auto’(default), ‘manual’
Visible ‘on’(default), ‘off’
XGrid,YGrid,ZGrid ‘on’, ‘off’(default)
Children Handles of images, lights, lines, …
Parent Handler of the figure window
Position 设置轴在figure中的大小与位置,[left bottom width height] (归一化的单位)
FontAngle ‘normal’(de), ‘italic’, ‘oblique’
FontName 字体类型
FontSize 10(de)
FontWeight 字体粗细 ‘normal’, ‘bold’, ‘light’
Title 标题 text句柄 注意:可以用text(x,y,’…’)函数创建text对象
XLabel,YLabel,ZLabel 轴标签 text句柄
XTick,YTick,ZTick 轴的划分
XTickMode,.. ‘auto’,’manual’
XTickLabel,… 轴刻度的标签
XTickLabelMode ‘auto’, ‘manual’
XAxisLocation x轴的位置 ‘bottom’, ‘top’
YAxisLocation y轴的位置 ‘left’, ‘right’
XLim,YLim,ZLim 轴的范围
XLimMode,.. ‘auto’, ‘manual’
XScale,.. 指定是线性刻度’linear’,或对数刻度’log’
Color 背景颜色ColorSpec ‘none’(de)
ColorOrder 指定线的颜色顺序 m行3列的RGB矩阵
XColor,YColor 轴的颜色ColorSpec
XMinorTick,YMinorTick ‘on’, ‘off’
Units 单位 inches | centimeters |{normalized} | points | pixels
| characters
2 Line的常用的属性
Parent 父轴
LineStyle {-} | – | : | -. | none
LineWidth .5(de)
Marker ‘+’ | ‘o’ | ‘*’ | ‘.’ | ‘x’ | ‘square’or ‘s’ | ‘diamond’ or ‘d’ | ‘^’ | ‘v’ | ‘>’ | ‘<’ | ‘pentagram’ or ‘p’ | ‘hexagram’or ‘h’ | {‘none’}
MarkerEdgeColor 由ColorSpec指定
MarkerFaceColor …
MarkerSize 6(de)
Color 线的颜色 ColorSpec指定
3 text对象的属性
FontSize
FontAngle ‘normal’, ‘italic’
Color
Interpreter tex, latex
4 bar对象属性
BarLayout 布局{grouped} | stacked
BarWidth bar宽scalar in range [0 1]
BaseLine 基准线句柄
BaseValue 基准线的位置
EdgeColor {[0 0 0]} | none | ColorSpec
FaceColor {flat} | none | ColorSpec
LineStyle {-} | – | : | -. | none
LineWidth sizein points
Parent 父轴
5 control legend
hle =legend([h1,h2,…], {‘sin(x)’,’cos(x)’, …});
set(hle, ‘propertyname’,propertyvalue, …);
get(hle, ‘type’)返回 ‘axes’,legend对象实际上是“轴”
6 对象通用属性
Parent 父对象句柄
Children 子对象句柄
Type 对象类型