ELK简介
Elasticsearch
开源分布式搜索引擎,它的特点有:分布式,零配置,自动发现,索引自动分片,索引副本机制,restful风格接口,多数据源,自动搜索负载等。也可以认为ElasticSearch是一个NoSQL存储中心,可以存储各种数据,并且查询速度超级快。
Logstash
完全开源的工具,可以从各种输入流(文件,队列,数据库)收集信息,并对信息进行处理,将处理后的信息存储到ElasticSearch
kibana
开源和免费的工具,它可以从ElasticSearch读取日志等存储的信息, 提供的日志分析友好的 Web 界面,可以帮助您汇总、分析和搜索重要数据日志。
1.Kibana安装与配置
[elk@server02 elk]# tar -zxvf kibana-6.2.4-linux-x86_64.tar.gz
[root@server02 kibana-6.2.4-linux-x86_64]# ls
bin config data LICENSE.txt node node_modules nohup.log NOTICE.txt optimize package.json plugins README.txt src ui_framework webpackShims
配置文件:
[root@server02 config]# grep "^\s*[^# \t].*$" config/kibana.yml
server.port: 5601
server.host: 0.0.0.0 #将本机的外网ip地址配置上,这样外网才能访问到
elasticsearch.url: "http://localhost:9200" ##配置EA的地址,本机使用localhost,可配置ip
启动:
nohup sh ./bin/kibana > nohup.log &
http://192.168.3.113:5601 #验证web页面启动
关闭kibana:ps -ef | grep node #查看进程,kill -9
2.LogStash安装与配置
[root@server02 elk]# tar -zxvf logstash-6.2.4.tar.gz
[root@server02 logstash-6.2.4]# cat config/logstash.conf
input {
beats {
port => "5043"
}
}
filter {
grok {
match => { "message" => "\[%{IP:ip}\] \[%{TIMESTAMP_ISO8601:timestamp}\] \[%{NOTSPACE:class}\]"}
}
}
output {
elasticsearch {
hosts => [ "http://localhost:9200" ]
}
}
启动:
[root@server02 logstash-6.2.4]# nohup bin/logstash -f config/logstash.conf > nohup.log &
3.Filebeat安装与配置
[root@server02 elk]# tar -zxvf filebeat-6.2.4-linux-x86_64.tar.gz
filebeat必须属于root用户名下;filebeat.yml中 enable项都由false改为true;
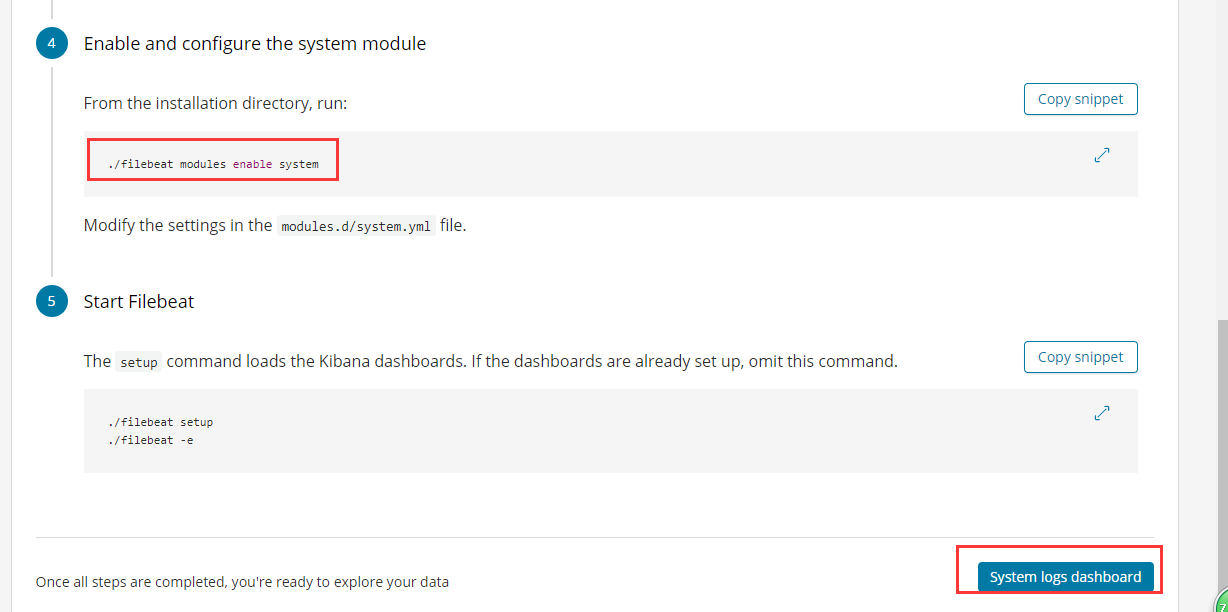
开启收集system系统日志: ./filebeat modules enable system

过滤配置文件中的注释空格等无用字符只显示生效配置:
[root@server02 filebeat-6.2.4-linux-x86_64]# grep "^\s*[^# \t].*$" filebeat.yml
filebeat.prospectors:
- type: log
enabled: true
paths:
- /var/log/*.log
filebeat.config.modules:
path: ${path.config}/modules.d/*.yml
reload.enabled: true
setup.template.settings:
index.number_of_shards: 3
setup.kibana:
host: "localhost:5601"
#output.elasticsearch:
#hosts: ["localhost:9200"]
output.logstash:
hosts: ["localhost:5043"]
启动:
nohup ./filebeat -e -c filebeat.yml -d "Publish" > filebeat.log &
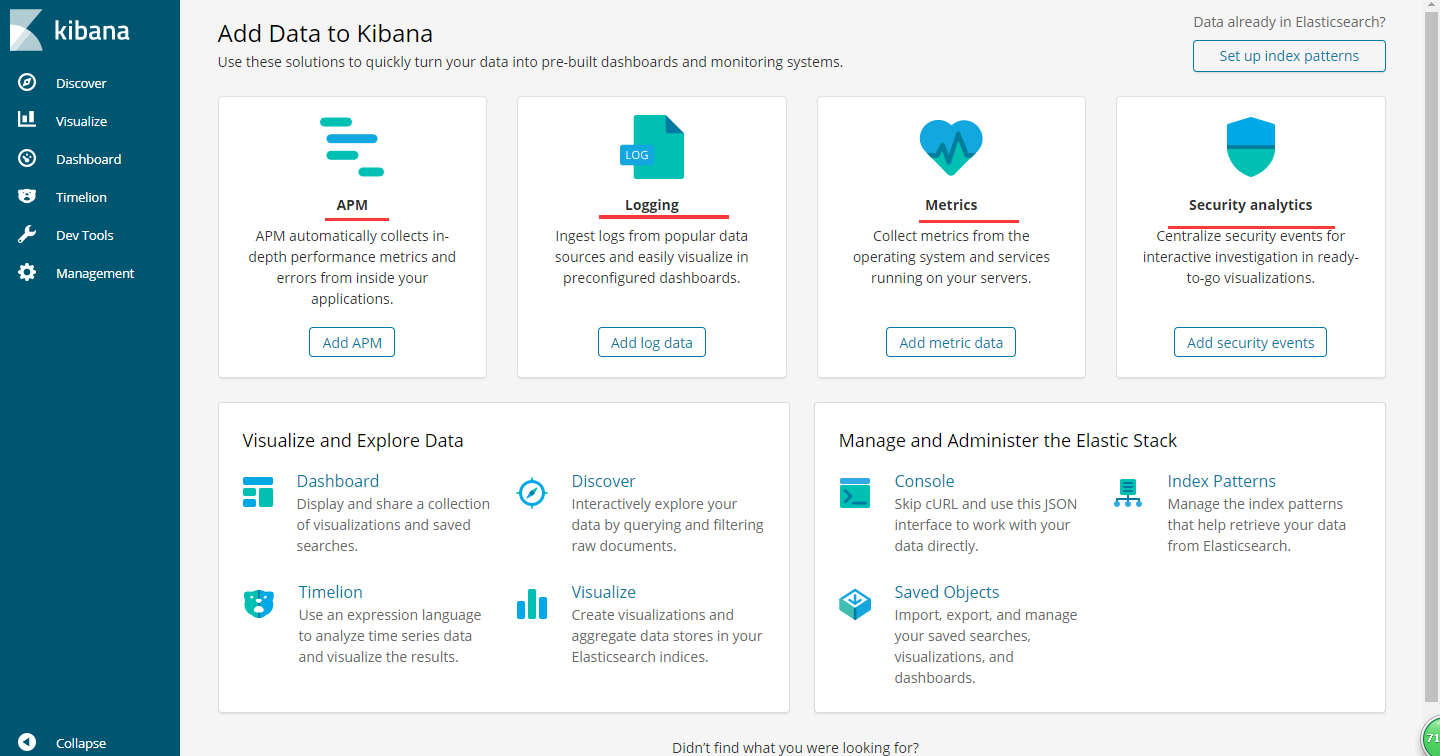
最后kibana配置:

选择对应需要收集展示的日志类型:如:System,nginx,apache,Redis等

按教程配置filebeat后按System logs dashboard
第一次访问的时候,会要求设置Index Pattern,因为我们在logstash-es.conf中设置为logstash-%{+YYYY-MM},所以设置为logstash-*就可以了。
Discover是主要的查询交互界面,如下所示:
