Pandas是著名的Python数据分析包,这使它更容易读取和转换数据。在Pandas中数据变形意味着转换表或向量(即DataFrame或Series)的结构,使其进一步适合做其他分析。在本文中,小编将举例说明最常见的一些Pandas重塑功能。
一、Pivot
pivot函数用于从给定的表中创建出新的派生表,pivot有三个参数:索引、列和值。具体如下:
def pivot_simple(index, columns, values):
    """
    Produce 'pivot' table based on 3 columns of this DataFrame.
    Uses unique values from index / columns and fills with values.

    Parameters
    ----------
    index : ndarray
        Labels to use to make new frame's index
    columns : ndarray
        Labels to use to make new frame's columns
    values : ndarray
        Values to use for populating new frame's values
作为这些参数的值需要事先在原始的表中指定好对应的列名。然后,pivot函数将创建一个新表,其行和列索引是相应参数的唯一值。我们一起来看一下下面这个例子:
假设我们有以下数据:
我们将数据读取进来:
from collections import OrderedDict
from pandas import DataFrame
import pandas as pd
import numpy as np

data = OrderedDict((
    ("item", ['Item1', 'Item1', 'Item2', 'Item2']),
    ('color', ['red', 'blue', 'red', 'black']),
    ('user',  ['1', '2', '3', '4']),
    ('bm',   ['1', '2', '3', '4'])
))
data = DataFrame(data)
print(data)
得到结果为:
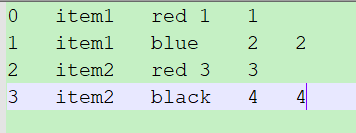
    item  color user bm
0  Item1    red    1  1
1  Item1   blue    2  2
2  Item2    red    3  3
3  Item2  black    4  4
接下来,我们对以上数据进行变形:
df = data.pivot(index='item', columns='color', values='user')
print(df)
得到的结果为:
color black  blue red
item
Item1  None     2   1
Item2     4  None   3
注意:可以使用以下方法对原始数据和转换后的数据进行等效查询:
# 原始数据集
print(data[(data.item=='Item1') & (data.color=='red')].user.values)

# 变换后的数据集
print(df[df.index=='Item1'].red.values)
结果为:
['1']
['1']
在以上的示例中,转化后的数据不包含bm的信息,它仅包含我们在pivot方法中指定列的信息。下面我们对上面的例子进行扩展,使其在包含user信息的同时也包含bm信息。
df2 = data.pivot(index='item', columns='color')
print(df2)
结果为:
       user              bm
color black  blue red black  blue red
item
Item1  None     2   1  None     2   1
Item2     4  None   3     4  None   3
从结果中我们可以看出:Pandas为新表创建了分层列索引。我们可以用这些分层列索引来过滤出单个列的值,例如:使用df2.user可以得到user列中的值。
二、Pivot Table
有如下例子:
data = OrderedDict((
    ("item", ['Item1', 'Item1', 'Item1', 'Item2']),
    ('color', ['red', 'blue', 'red', 'black']),
    ('user',  ['1', '2', '3', '4']),
    ('bm',   ['1', '2', '3', '4'])
))
data = DataFrame(data)

df = data.pivot(index='item', columns='color', values='user')
得到的结果为:
ValueError: Index contains duplicate entries, cannot reshape因此,在调用pivot函数之前,我们必须确保我们指定的列和行没有重复的数据。如果我们无法确保这一点,我们可以使用pivot_table这个方法。
pivot_table方法实现了类似pivot方法的功能,它可以在指定的列和行有重复的情况下使用,我们可以使用均值、中值或其他的聚合函数来计算重复条目中的单个值。
首先,我们先来看一下pivot_table()这个方法:
def pivot_table(data, values=None, index=None, columns=None, aggfunc='mean',
                fill_value=None, margins=False, dropna=True,
                margins_name='All'):
    """
    Create a spreadsheet-style pivot table as a DataFrame. The levels in the
    pivot table will be stored in MultiIndex objects (hierarchical indexes) on
    the index and columns of the result DataFrame

    Parameters
    ----------
    data : DataFrame
    values : column to aggregate, optional
    index : column, Grouper, array, or list of the previous
        If an array is passed, it must be the same length as the data. The list
        can contain any of the other types (except list).
        Keys to group by on the pivot table index.  If an array is passed, it
        is being used as the same manner as column values.
    columns : column, Grouper, array, or list of the previous
        If an array is passed, it must be the same length as the data. The list
        can contain any of the other types (except list).
        Keys to group by on the pivot table column.  If an array is passed, it
        is being used as the same manner as column values.
    aggfunc : function or list of functions, default numpy.mean
        If list of functions passed, the resulting pivot table will have
        hierarchical columns whose top level are the function names (inferred
        from the function objects themselves)
    fill_value : scalar, default None
        Value to replace missing values with
    margins : boolean, default False
        Add all row / columns (e.g. for subtotal / grand totals)
    dropna : boolean, default True
        Do not include columns whose entries are all NaN
    margins_name : string, default 'All'
        Name of the row / column that will contain the totals
        when margins is True.
接下来我们来看一个示例:
data = OrderedDict((
    ("item", ['Item1', 'Item1', 'Item1', 'Item2']),
    ('color', ['red', 'blue', 'red', 'black']),
    ('user',  ['1', '2', '3', '4']),
    ('bm',   ['1', '2', '3', '4'])
))
data = DataFrame(data)

df = data.pivot_table(index='item', columns='color', values='user', aggfunc=np.min)
print(df)
结果为:
color black  blue   red
item
Item1  None     2     1
Item2     4  None  None
实际上,pivot_table()是pivot()的泛化,它允许在数据集中聚合具有相同目标的多个值。
三、Stack/Unstack
事实上,变换一个表只是堆叠DataFrame的一种特殊情况,假设我们有一个在行列上有多个索引的DataFrame。堆叠DataFrame意味着移动最里面的列索引成为最里面的行索引,反向操作称之为取消堆叠,意味着将最里面的行索引移动为最里面的列索引。例如:
from pandas import DataFrame
import pandas as pd
import numpy as np

# 建立多个行索引
row_idx_arr = list(zip(['r0', 'r0'], ['r-00', 'r-01']))
row_idx = pd.MultiIndex.from_tuples(row_idx_arr)

# 建立多个列索引
col_idx_arr = list(zip(['c0', 'c0', 'c1'], ['c-00', 'c-01', 'c-10']))
col_idx = pd.MultiIndex.from_tuples(col_idx_arr)

# 创建DataFrame
d = DataFrame(np.arange(6).reshape(2,3), index=row_idx, columns=col_idx)
d = d.applymap(lambda x: (x // 3, x % 3))

# Stack/Unstack
s = d.stack()
u = d.unstack()
print(s)
print(u)
得到的结果为:
                  c0      c1
r0 r-00 c-00  (0, 0)     NaN
        c-01  (0, 1)     NaN
        c-10     NaN  (0, 2)
   r-01 c-00  (1, 0)     NaN
        c-01  (1, 1)     NaN
        c-10     NaN  (1, 2)

        c0                              c1
      c-00            c-01            c-10
      r-00    r-01    r-00    r-01    r-00    r-01
r0  (0, 0)  (1, 0)  (0, 1)  (1, 1)  (0, 2)  (1, 2)
实际上,Pandas允许我们在索引的任何级别上堆叠/取消堆叠。 因此,在前面的示例中,我们也可以堆叠在最外层的索引级别上。 但是,默认(最典型的情况)是在最里面的索引级别进行堆叠/取消堆叠。