Python 数据加工 之 Matplotlib(散点图)
—b站 python数据分析(黑马程序员)
假设通过爬虫你获取到了北京2016年3,10月份每天白天的最高气温(分别位于列表a,b),那么此时如何寻找出气温和随时间(天)变化的某种规律?
a = [11,17,16,11,12,11,12,6,6,7,8,9,12,15,14,17,18,21,16,17,20,14,15,15,15,19,21,22,22,22,23]
b = [26,26,28,19,21,17,16,19,18,20,20,19,22,23,17,20,21,20,22,15,11,15,5,13,17,10,11,13,12,13,6]
唯一区别
plt.plot(x,y)	# 折线
plt.scatter(x,y)	# 散点
代码如下
from matplotlib import pyplot as plt
# 中文显示
plt.rcParams['font.sans-serif'] = [u'SimHei']
plt.rcParams['axes.unicode_minus'] = False
y_3 = [11, 17, 16, 11, 12, 11, 12, 6, 6, 7, 8, 9, 12, 15, 14, 17, 18, 21, 16, 17, 20, 14, 15, 15, 15, 19, 21, 22, 22,
22, 23]
y_10 = [26, 26, 28, 19, 21, 17, 16, 19, 18, 20, 20, 19, 22, 23, 17, 20, 21, 20, 22, 15, 11, 15, 5, 13, 17, 10, 11, 13,
12, 13, 6]
x_3 = range(1, 32)
x_10 = range(51, 82)
# 设置图形大小
plt.figure(figsize=(20, 8), dpi=80)
plt.scatter(x_3, y_3, label='三月')
plt.scatter(x_10, y_3, label='十月')
# 调整x轴的刻度
xTicks = list(x_3) + list(x_10)
yTicks = ['3月{}日'.format(i) for i in x_3] + ['10月{}日'.format(i - 50) for i in x_3]
plt.xticks(xTicks[::3], yTicks[::3],rotation=45)
# 图例
plt.legend()
# 其他信息
plt.xlabel('月份')
plt.ylabel('温度')
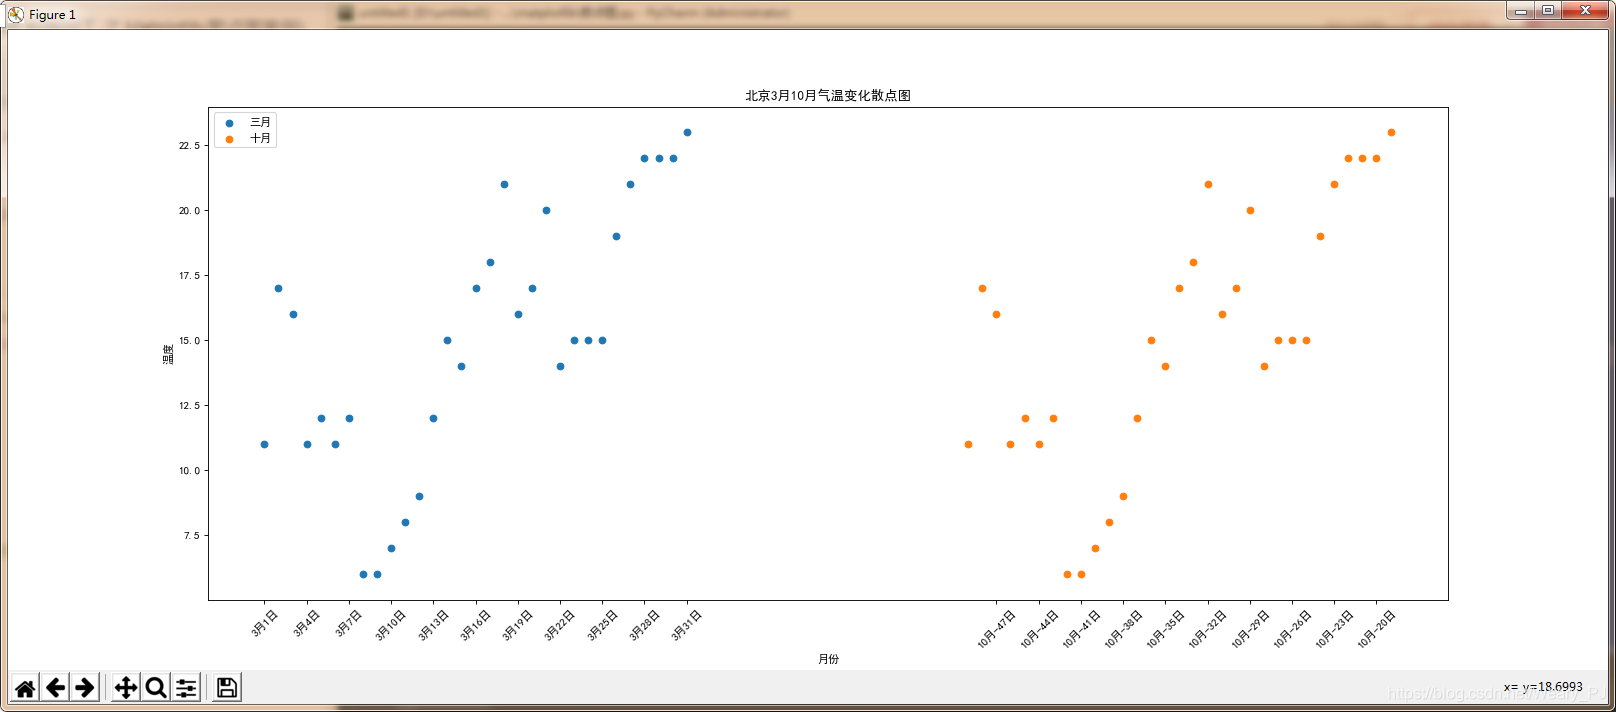
plt.title('北京3月10月气温变化散点图')
# 展示
plt.show()
效果如下