Goal
In this tutorial you will learn how to:
- Use the OpenCV functionto divide an image into its correspondent planes.
- 使用OpenCV函数:cv::split分离一个多通道图像为几个相应的单通道图像。
- To calculate histograms of arrays of images by using the OpenCV function cv::calcHist
- 使用OpenCV函数:cv::calcHist计算图像的直方图。
- To normalize an array by using the function cv::normalize
- 使用OpenCV函数:cv::normalize进行归一化。
- Note
-
In the last tutorial (Histogram Equalization) we talked about a particular kind of histogram called Image histogram. Now we will considerate it in its more general concept. Read on!
在上个教程里,讨论了直方图。现在我们需要了解其更多的一般概念!继续阅读
What are histograms?
- Histograms are collected counts of data organized into a set of predefined bins
- 直方图就是计算相应的灰度值数量的多少,最后汇总形成的一个图。
- When we say data we are not restricting it to be intensity values (as we saw in the previous Tutorial). The data collected can be whatever feature you find useful to describe your image.
- 数据并不一定是灰度值。数据可以是任何采集到用于描述图像的特征。
Let's see an example. Imagine that a Matrix contains information of an image (i.e. intensity in the range 0−255):
- 如这个例子。假设一个图像包含了灰度值(0~255)。
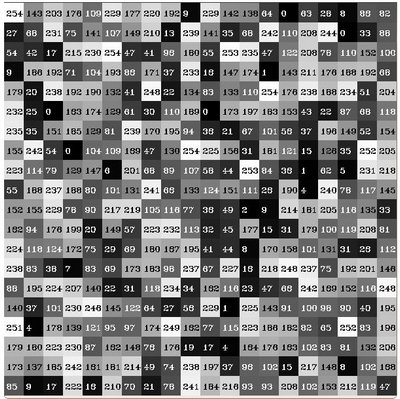
What happens if we want to count this data in an organized way? Since we know that the range of information value for this case is 256 values, we can segment our range in subparts (called bins) like:
以下面上面这些方式分割整个范围,并同意每一段像素的数量。

and we can keep count of the number of pixels that fall in the range of each bini. Applying this to the example above we get the image below ( axis x represents the bins and axis y the number of pixels in each of them).
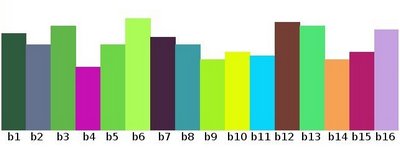
这样我们就得到了直方图,如上图所示。
This was just a simple example of how an histogram works and why it is useful. An histogram can keep count not only of color intensities, but of whatever image features that we want to measure (i.e. gradients, directions, etc).
上面是一个简单的例子,讲解了如何计算灰度值和为什么它比较有用。一个直方图并不仅仅可任意同意颜色值,并且可以是任何的图像的特征。
Let's identify(确定) some parts of the histogram:
- dims: The number of parameters you want to collect data of. In our example, dims = 1 because we are only counting the intensity values of each pixel (in a greyscale image).
- 不知道怎么翻译比较好:就是参数的数量,这个是1,因为只有一个参数,就是只统计了像素的灰度值。
- bins: It is the number of subdivisions in each dim. In our example, bins = 16
- bins:每个dim分割的数量,如上面bins=16.
- range: The limits for the values to be measured. In this case: range = [0,255]
- range:特征变化的范围,比如灰度值就是0~255.
What if you want to count two features? In this case your resulting histogram would be a 3D plot (in which x and y would be binx and biny for each feature and z would be the number of counts for each combination of (binx,biny). The same would apply for more features (of course it gets trickier棘手的).
当你想要统计两个特征的时候,在这个情况下的直方图就是一个3维的。当然计算会变的更加复杂。
Code
- What does this program do?
#include "opencv2/imgcodecs.hpp"
#include "opencv2/imgproc.hpp"
#include <iostream>
using namespace std;
using namespace cv;
int main(int argc, char** argv)
{
Mat src, dst;
String imageName( "lena.jpg" ); // by default
if (argc > 1)
{
imageName = argv[1];
}
src = imread( imageName, IMREAD_COLOR );
if( src.empty() )
{ return -1; }
vector<Mat> bgr_planes;
split( src, bgr_planes ); //分离三通道
int histSize = 256;
float range[] = { 0, 256 } ;
const float* histRange = { range };
bool uniform = true; bool accumulate = false;
Mat b_hist, g_hist, r_hist;
calcHist( &bgr_planes[0], 1, 0, Mat(), b_hist, 1, &histSize, &histRange, uniform, accumulate );
//图像,图像的数量,统计的通道号,掩码(空),目标直方图,维度,存放直方图每个维度的数组,每一个维度取值的范围,bins是否为均匀,开始清除为零.第8个参数,const 指针的指针
calcHist( &bgr_planes[1], 1, 0, Mat(), g_hist, 1, &histSize, &histRange, uniform, accumulate );
calcHist( &bgr_planes[2], 1, 0, Mat(), r_hist, 1, &histSize, &histRange, uniform, accumulate );
//cout << b_hist << endl;
// Draw the histograms for B, G and R
int hist_w = 512; int hist_h = 400;
int bin_w = cvRound( (double) hist_w/histSize ); //4舍5入
Mat histImage( hist_h, hist_w, CV_8UC3, Scalar( 0,0,0) ); //创建一个图像
normalize(b_hist, b_hist, 0, histImage.rows, NORM_MINMAX, -1, Mat() );
//输入,输出,最小值,最大值,归一化类型,输出数组雨输入数组的类型相同,掩码
normalize(g_hist, g_hist, 0, histImage.rows, NORM_MINMAX, -1, Mat() );
normalize(r_hist, r_hist, 0, histImage.rows, NORM_MINMAX, -1, Mat() );
//cout << b_hist << endl;
for( int i = 1; i < histSize; i++ )
{
line( histImage, Point( bin_w*(i-1), hist_h - cvRound(b_hist.at<float>(i-1)) ) ,
Point( bin_w*(i), hist_h - cvRound(b_hist.at<float>(i)) ),
Scalar( 255, 0, 0), 2, 8, 0 ); //实际上图像的坐标原点为左上角,而我们更愿意的是左下角,调整。
line( histImage, Point( bin_w*(i-1), hist_h - cvRound(g_hist.at<float>(i-1)) ) ,
Point( bin_w*(i), hist_h - cvRound(g_hist.at<float>(i)) ),
Scalar( 0, 255, 0), 2, 8, 0 );
line( histImage, Point( bin_w*(i-1), hist_h - cvRound(r_hist.at<float>(i-1)) ) ,
Point( bin_w*(i), hist_h - cvRound(r_hist.at<float>(i)) ),
Scalar( 0, 0, 255), 2, 8, 0 );
}
namedWindow("calcHist Demo", WINDOW_AUTOSIZE );
imshow("calcHist Demo", histImage );
waitKey(0);
return 0;
}
Explanation
对于归一化的函数进行解释:
函数原型:
void normalize(InputArray src,OutputArraydst, double alpha = 1, double beta = 0, intnorm_type = NORM_L2, int dtype = -1, InputArray mask = noArray() )
该函数归一化输入数组使它的范数或者数值范围在一定的范围内。
Parameters:
src
输入数组
dst
输出数组,支持原地运算
alpha
range normalization模式的最小值
beta
range normalization模式的最大值,不用于norm normalization(范数归一化)模式。
normType
归一化的类型,可以有以下的取值:
NORM_MINMAX:数组的数值被平移或缩放到一个指定的范围,线性归一化,一般较常用。
NORM_INF:此类型的定义没有查到,根据OpenCV 1的对应项,可能是归一化数组的C-范数(绝对值的最大值)
NORM_L1 : 归一化数组的L1-范数(绝对值的和)
NORM_L2: 归一化数组的(欧几里德)L2-范数
dtype
dtype为负数时,输出数组的type与输入数组的type相同;
否则,输出数组与输入数组只是通道数相同,而tpye=CV_MAT_DEPTH(dtype).
mask
操作掩膜,用于指示函数是否仅仅对指定的元素进行操作。
3.归一化公式:
1、线性函数转换,表达式如下:(对应NORM_MINMAX)
if mask(i,j)!=0
dst(i,j) = (src(i,j) - min(src)) * (b' - a') / (max(src) - min(src)) + a'
else
dst(i,j) = src(i,j)
其中b' = MAX(alpha,beta ) , a' = MIN(alpha,beta );
2. 当norm_type!=NORM_MINMAX:
if mask(i,j) != 0
dst(i,j) = src(i,j) *alpha / norm (src,norm_type,mask)
else
dst(i,j) = src(i,j)
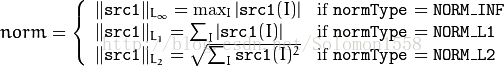
其中,函数norm的功能是计算norm(范数)的绝对值
Thefunctions norm calculate an absolute norm of src1 (when there is no src2 ):
CMakeLists.txt
cmake_minimum_required(VERSION 2.8)
project( DisplayImage )
find_package( OpenCV REQUIRED )
include_directories( ${OpenCV_INCLUDE_DIRS} )
add_executable( DisplayImage main.cpp )
target_link_libraries( DisplayImage ${OpenCV_LIBS} )
install(TARGETS DisplayImage RUNTIME DESTINATION bin
Results
