bar函数
matplotlib.pyplot.bar(*args, **kwargs)
bar(x, height, *, align='center', **kwargs)
bar(x, height, width, *, align='center', **kwargs)
bar(x, height, width, bottom, *, align='center', **kwargs)
参数
x : 标量序列,x坐标
height : 标量或标量序列,bar的高度
width : 标量或标量类数组,可选,bar的宽度,默认0.8,
bottom : 标量或标量类数组,可选,y坐标的起始高度,默认0
align : {‘center’, ‘edge’}, 可选,对齐方式,默认: ‘center’
‘center’: 居中对齐
‘edge’: 左对齐,如果width为负,则为右对齐
color : 标量或标量类数组,可选,设置bar的颜色
edgecolor : 标量或标量类数组,可选, 设置bar边的颜色
linewidth : 标量或标量类数组,可选,设置bar边的大小
tick_label :字符串或类数组,可选,设置bar的标签
xerr, yerr : scalar or array-like of shape(N,) or shape(2,N), optional
scalar: symmetric +/- values for all bars
shape(N,): symmetric +/- values for each bar
shape(2,N): separate + and - values for each bar
ecolor : 标量或标量类数组,可选, errorbars的颜色,默认: ‘black’
capsize : 标量, 可选,默认rcParams["errorbar.capsize"]
error_kw : 字典, 可选
log : bool, 可选, 默认: False,y坐标是否使用科学计数法
orientation : {‘vertical’, ‘horizontal’}, 可选,内部使用,如果需要水平使用barh
返回值
BarContainer 所有的bar对象
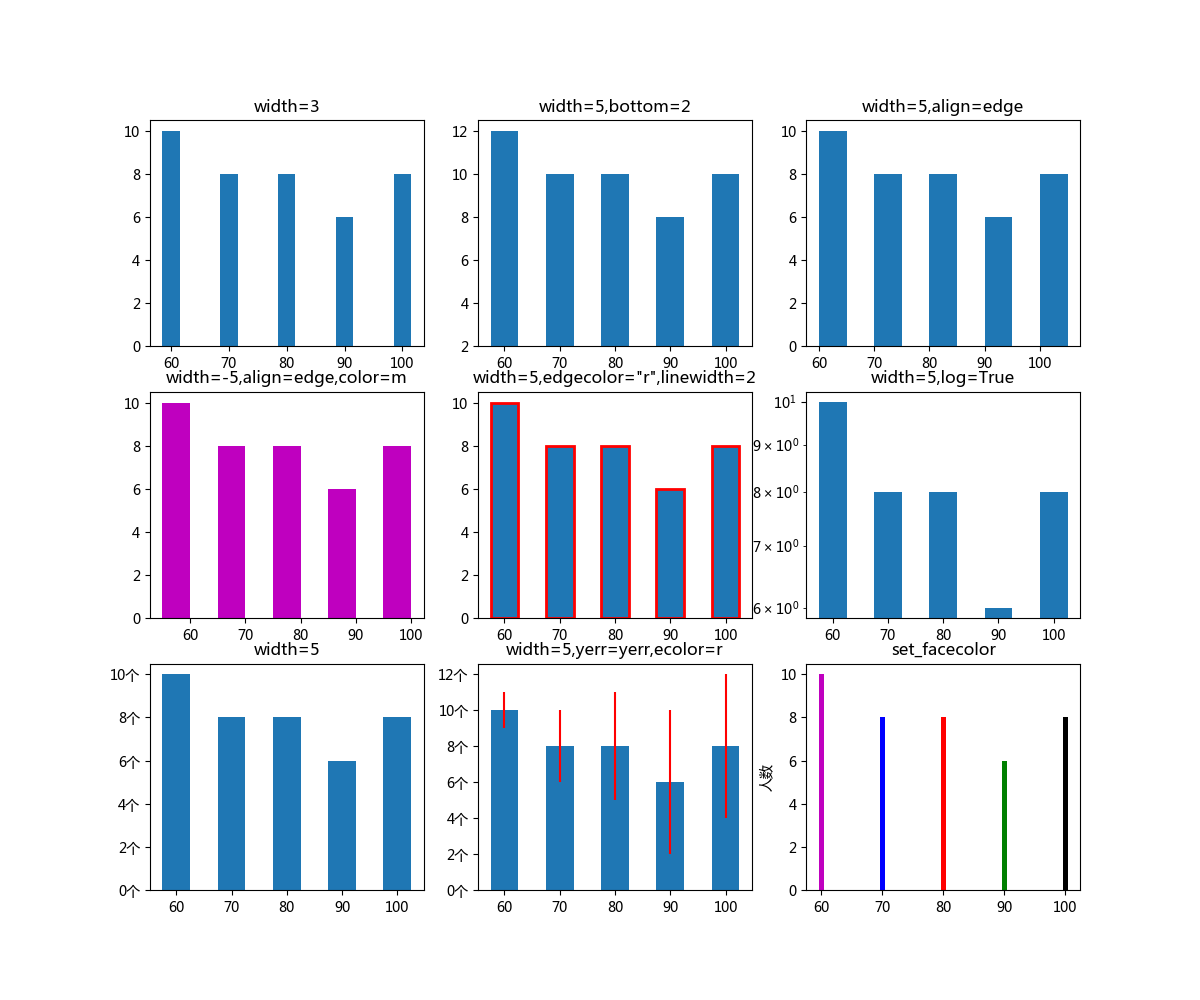
bar实例
#-*-coding:utf-8-*-
import numpy as np
import matplotlib.pyplot as plt
import pandas as pd
import random
from matplotlib.ticker import FuncFormatter


def xFormat(x, pos):
    'The two args are the value and tick position'
    return u'%d个' % (x)

formatter = FuncFormatter(xFormat)

girls = [8,10,9,9,2]
boys = [10,8,8,6,8]
x = [60,70,80,90,100]
yerr = [1,2,3,4,4]
colors = "rgbkcm"

# plt.gcf().set_size_inches(12,8)
plt.figure(figsize=(12,10))

# 画布划分为3行3列的网格并且选中第一个网格
ax = plt.subplot(331)
plt.bar(x,boys,width=3)
ax.set_title('width=3')

ax = plt.subplot(332)
plt.bar(x,boys,width=5,bottom=2)
ax.set_title('width=5,bottom=2')

ax = plt.subplot(333)
plt.bar(x,boys,width=5,align="edge")
ax.set_title('width=5,align=edge')

ax = plt.subplot(334)
plt.bar(x,boys,width=-5,align="edge",color="m")
ax.set_title('width=-5,align=edge,color=m')

ax = plt.subplot(335)
ax.set_title('width=5,edgecolor="r",linewidth=2')
plt.bar(x,boys,width=5,edgecolor="r",linewidth=2)

ax = plt.subplot(336)
plt.bar(x,boys,width=5,log=True)
ax.set_title('width=5,log=True')

ax = plt.subplot(337)
ax.yaxis.set_major_formatter(formatter)
ax.set_title('width=5')
plt.bar(x,boys,width=5)

ax = plt.subplot(338)
ax.yaxis.set_major_formatter(formatter)
ax.set_title('width=5,yerr=yerr,ecolor=r')
plt.bar(x,boys,width=5,yerr=yerr,ecolor='r')

ax = plt.subplot(339)
# ax.set_xticklabels([60,70,80,90,100])
plt.xticks(x,x)
ax.set_ylabel(u'人数')
ax.set_xlabel(u'分数')
ax.set_title('set_facecolor')
bars = plt.bar(x,boys)
for bar in bars:
    bar.set_facecolor(random.choice(colors))

plt.savefig("bar.png")
plt.show()

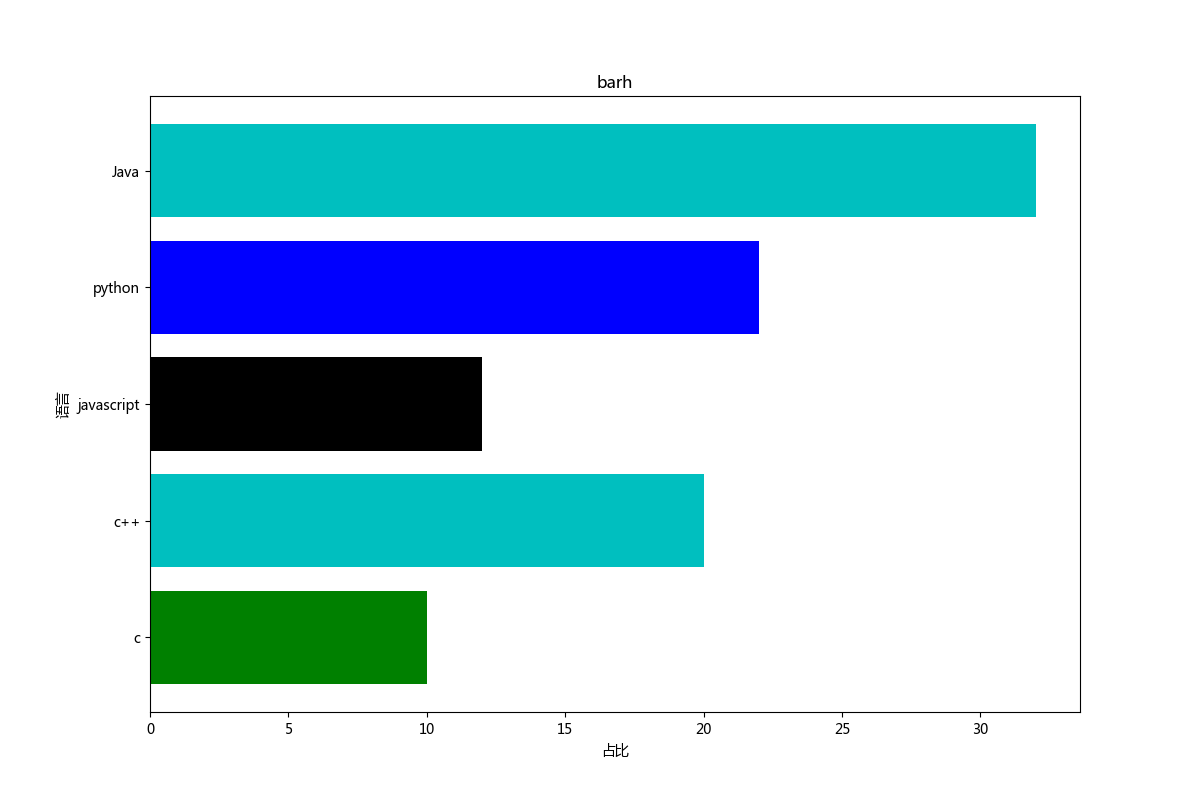
barh
#-*-coding:utf-8-*-
import numpy as np
import matplotlib.pyplot as plt
import pandas as pd
import random

y = [1,2,3,4,5]

x= [10,20,12,22,32]

tick_label = ["c","c++","javascript","python","Java"]
colors = "rgbkcm"

plt.gcf().set_size_inches(12,8)


ax = plt.subplot(111)
ax.set_title('barh')
ax.set_ylabel(u'语言')
ax.set_xlabel(u'占比')
bars = plt.barh(y,x,tick_label=tick_label)
for bar in bars:
    bar.set_facecolor(random.choice(colors))

plt.savefig("barh.png")
plt.show()
