要求:

思路:
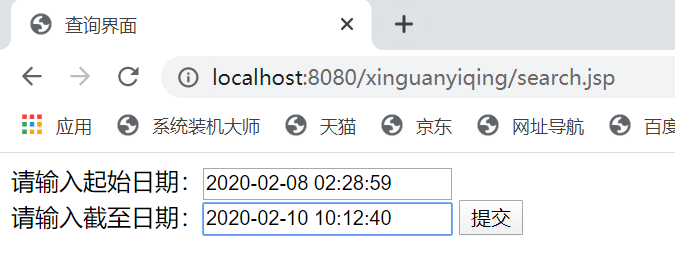
从前台中获取这两个时间数据,在后台进行数据的查询;
借助echart图表,导入echart.min.js;

dao:


import java.sql.Connection;
import java.sql.PreparedStatement;
import java.sql.ResultSet;
import java.sql.SQLException;
import java.util.ArrayList;
import java.util.List;

import com.mysql.jdbc.Statement;
//import com.sun.org.apache.xpath.internal.operations.And;


public class dao {

    public List<information> search1(String beginyear,String endyear){
        int num=0;
        List<information>list=new ArrayList<information>();
    Connection con=null;
    java.sql.Statement psts=null;
     ResultSet rs=null;
    try {
        con=db.getCon();
        String sql="select * from info where Date between '"+beginyear+"' and '"+endyear+"'";
        System.out.print(sql);
        psts=con.createStatement();
        rs=psts.executeQuery(sql);
        while(rs.next()){
            String id=rs.getString("Id");
            String date=rs.getString("Date");
             String province=rs.getString("Province");
             String city=rs.getString("City");
             String confirmed_num=rs.getString("Confirmed_num");
             String yisi_num=rs.getString("Yisi_num");
             String cured_num=rs.getString("Cured_num");
             String dead_num=rs.getString("Dead_num");

             information data=new information(id,date,province,city,confirmed_num,yisi_num,cured_num,dead_num);
             list.add(data);

        }
    } catch (SQLException e) {
        e.printStackTrace();
    }
    return list;
}
    public static void main(String[] args) {
        dao dataDao=new dao();
        List<information>list=dataDao.search1("2020-02-08 02:28:59","2020-02-08 02:28:59");
        int size=list.size();
        System.out.print(size);

    }
}
servlet:
import java.io.IOException;
import java.util.ArrayList;
import java.util.List;

import javax.servlet.ServletException;
import javax.servlet.annotation.WebServlet;
import javax.servlet.http.HttpServlet;
import javax.servlet.http.HttpServletRequest;
import javax.servlet.http.HttpServletResponse;
import com.google.gson.Gson;


/**
 * Servlet implementation class searchServlet
 */
@WebServlet("/searchServlet")
public class searchServlet extends HttpServlet {
    private static final long serialVersionUID = 1L;

    /**
     * @see HttpServlet#HttpServlet()
     */
    public searchServlet() {
        super();
        // TODO Auto-generated constructor stub
    }

    /**
     * @see HttpServlet#doGet(HttpServletRequest request, HttpServletResponse response)
     */
    protected void doGet(HttpServletRequest request, HttpServletResponse response) throws ServletException, IOException {
        // TODO Auto-generated method stub
        //response.getWriter().append("Served at: ").append(request.getContextPath());
        request.setCharacterEncoding("utf-8");
        response.setContentType("text/html;charset=utf-8");

        String beginyearString=request.getParameter("beginyear");
        String endyearString=request.getParameter("endyear");

        List<information>list=new ArrayList<information>();
        dao dataDao=new dao();
        list=dataDao.search1(beginyearString, endyearString);
        if (list!=null) {
            System.out.print("查询成功");
            request.setAttribute("list", list);
            request.getRequestDispatcher("show.jsp").forward(request, response);
        }

    }

    /**
     * @see HttpServlet#doPost(HttpServletRequest request, HttpServletResponse response)
     */
    protected void doPost(HttpServletRequest request, HttpServletResponse response) throws ServletException, IOException {
        // TODO Auto-generated method stub
        doGet(request, response);
    }
}
show.jsp:
<%@ page language="java" contentType="text/html; charse=tUTF-8"
    pageEncoding="UTF-8"%>
    <%@page import="java.util.List"%>
    <%@page import="yiqing.information"%>
    <%@taglib uri="http://java.sun.com/jsp/jstl/core" prefix="c" %>
<!DOCTYPE html>
<html>
<head>
<meta charset="UTF-8">
<title>信息显示页面</title>
</head>
    <!-- 引入 echarts.js -->
    <script src="https://cdn.staticfile.org/echarts/4.3.0/echarts.min.js"></script>
    <script type="text/javascript">
//     List<Data>list=request.getAttribute("list");
//     var names=new Array();
//     var chartData=new Array();
//     var length=list.length;
//     for(i=0;i<length;i++){
//         names.pust(list[i].city);
//         chartData.push(list[i].confirmed_num);
//     }
    </script>

</head>
<body>


<%    request.setCharacterEncoding("utf-8");
List <information> provinces =(List<information>) request.getAttribute("list");
int i=0;%>
<div align="center">
    <div id="main" align="center" style="width: 750px;height:430px;" >
    <script type="text/javascript">
        var myChart = echarts.init(document.getElementById('main'));
        var option = {
                dataset: {
                    source: [
                        [  '省份','确诊人数'],
                        <%
                        //获取request域中的数据
                        if(provinces!=null){
                        for(information province:provinces){i++;
                    %>
                    ['<%=province.getProvince()%>','<%=province.getConfirmed_num()%>'],
                    <%
                        if(i>33)break;
                        }

                        }
                    %>
                    ]
                },
                grid: {containLabel: true},
                xAxis: {
                    type: 'category',
                    axisLabel:{
                        interval:0,//横轴信息全部显示
                        rotate:40,//-30度角倾斜显示
                         }
                    },
                yAxis: {},
                series: [
                    {
                        type: 'bar',
                        encode: {
                            // 将 "amount" 列映射到 X 轴。
                            x: '省份',
                            // 将 "product" 列映射到 Y 轴。
                            y: '确诊人数'
                        }
                    }]
        };

        // 使用刚指定的配置项和数据显示图表。
        myChart.setOption(option);
    </script>
    </div>


    </div>

<table>
<tr>
    <td>省份</td>
    <td>确诊人数</td>
    <td>时间</td>
</tr>
<c:forEach items="${list }" var="list">
<tr>
  <td>${list.province }</td>
  <td>${list.confirmed_num }</td>
  <td>${list.date }</td>
</tr>
</c:forEach>
</table>

</body>
</html>
运行结果: