DataFrame.plot函数详解(六)
使用subplot()做子图,定位每一个子图,设置数据和图形,理解fig和ax(axs)的意义和作用。
1. subplot()
matplotlib.pyplot.subplots(nrows=1, ncols=1, *, sharex=False, sharey=False, squeeze=True, width_ratios=None, height_ratios=None, subplot_kw=None, gridspec_kw=None, **fig_kw)
nrows=1, ncols=1 ,行列子图数量,默认1
sharex=False, sharey=False,子图共享XY轴,默认不共享
1.True或者’all’:x或y轴属性将在所有子图(subplots)中共享.
2.False或’none’:每个子图的x或y轴都是独立的部分
3.‘row’:每个子图在一个x或y轴共享行(row)
4.‘col’:每个子图在一个x或y轴共享列(column)
当子图在x轴有一个共享列时(‘col’),只有底部子图的x tick标记是可视的。
同理,当子图在y轴有一个共享行时(‘row’),只有第一列子图的y tick标记是可视的。
squeeze:布尔类型,可选参数,默认:True。
如果是True,额外的维度从返回的Axes(轴)对象中挤出。
如果只有一个子图被构建(nrows=ncols=1),结果是单个Axes对象作为标量被返回。
对于N1或1N个子图,返回一个1维数组。
对于N*M,N>1和M>1返回一个2维数组。
如果是False,不进行挤压操作:返回一个元素为Axes实例的2维数组,即使它最终是1x1。
subplot_kw:字典类型,可选参数。把字典的关键字传递给add_subplot()来创建每个子图。
gridspec_kw字典类型,可选参数。把字典的关键字传递给GridSpec构造函数创建子图放在网格里(grid)。
**fig_kw:把所有详细的关键字参数传给figure()函数
返回结果:
fig:matplotlib.figure.Figure对象
ax:Axes(轴)对象或Axes(轴)对象数组。
2.示例
import matplotlib.pyplot as plt
import numpy as np
import pandas as pd
df = pd.DataFrame({'apple':abs(np.random.randn(8)),'orange':abs(np.random.randn(8)),
'grape':abs(np.random.randn(8)),'banana':abs(np.random.randn(8))},
index=pd.date_range('2022-01-01', periods=8))
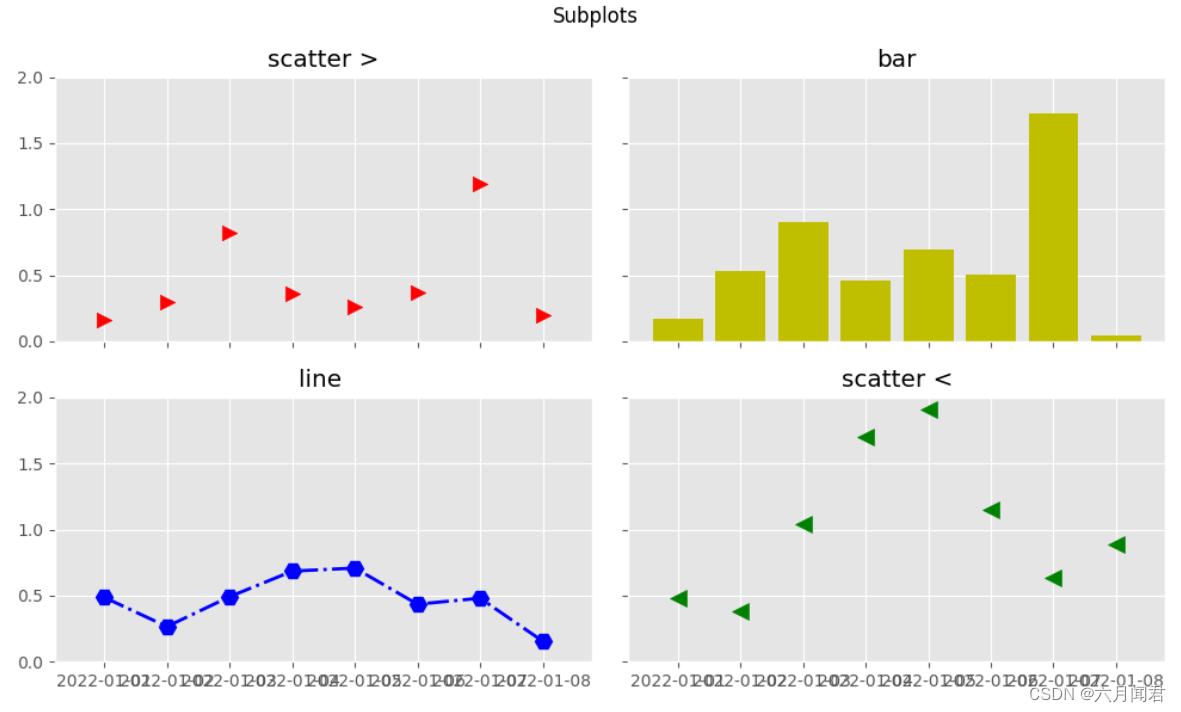
# 2*2 个子图
fig, axs = plt.subplots(2, 2, sharex=True, sharey=True,figsize=(10,6))
# 主图的标题
fig.suptitle ('Subplots')
#第一个子图
axs[0, 0].scatter(df.index, df['apple'], s=80, color='r', marker=">")
axs[0, 0].set_title("scatter >")
#第二个子图
axs[0, 1].bar(df.index, df['orange'], color='y')
axs[0, 1].set_title("bar")
#第三个子图
axs[1, 0].plot(df.index, df['grape'], color='b',marker='H',markersize = 10,linestyle='-.',linewidth=2)
axs[1, 0].set_title("line ")
#第四个子图
axs[1, 1].scatter(df.index, df['banana'], s=100, color='g',marker='<')
axs[1, 1].set_title("scatter <")
plt.tight_layout()
plt.show()
效果如下:
3. 理解subplot()返回值
subplot()返回值:
fig:matplotlib.figure.Figure对象
ax:Axes(轴)对象或Axes(轴)对象数组。
print(type(fig))
print(type(plt.figure))
print(type(axs))
结果如下:
<class ‘matplotlib.figure.Figure’>
<class ‘function’>
<class ‘numpy.ndarray’>
- plt.figure是一个函数<class ‘function’>
- plt.figure()的返回类<class ‘matplotlib.figure.Figure’>的一个实例fig
- ax的类型需要根据plt.subplots()的参数来确定,plt.subplots()会返回<class ‘matplotlib.axes.Axes’>的1个实例ax,plt.subplots(2,2)会返回Axes实例的集合axs。ax/axs/axes一般都是指类Axes的一个实例或实例的集合。
4.子图删除
import matplotlib.pyplot as plt
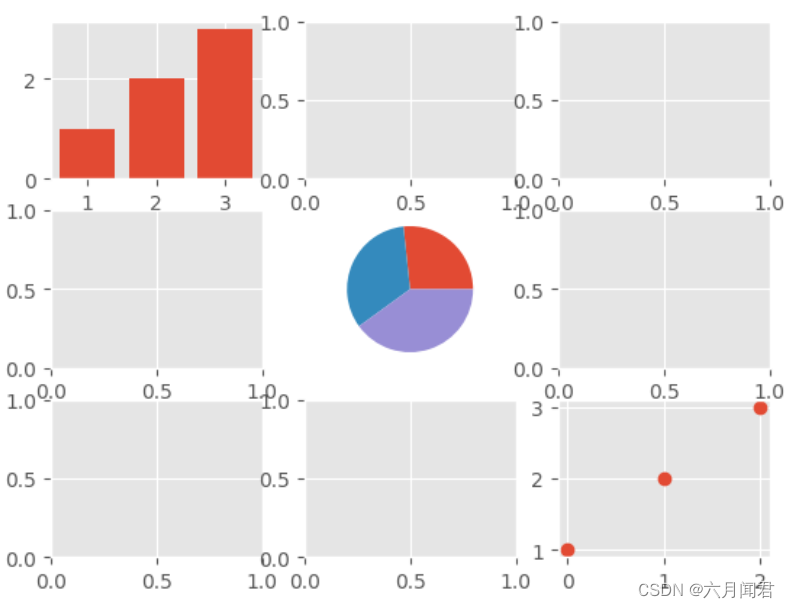
# 添加3行3列子图9个子图
fig, axes = plt.subplots(3, 3)
# 为第1个子图绘制图形
axes[0, 0].bar(range(1, 4), range(1, 4))
# 为第5个子图绘制图形
axes[1, 1].pie([4, 5, 6])
# 为第9个子图绘制图形
axes[2, 2].plot([1,2,3], 'o')
plt.show()
import matplotlib.pyplot as plt
# 添加3行3列子图9个子图
fig, axes = plt.subplots(3, 3)
# 为第1个子图绘制图形
axes[0, 0].bar(range(1, 4), range(1, 4))
# 为第5个子图绘制图形
axes[1, 1].pie([4, 5, 6])
# 为第9个子图绘制图形
axes[2, 2].plot([1,2,3], 'o')
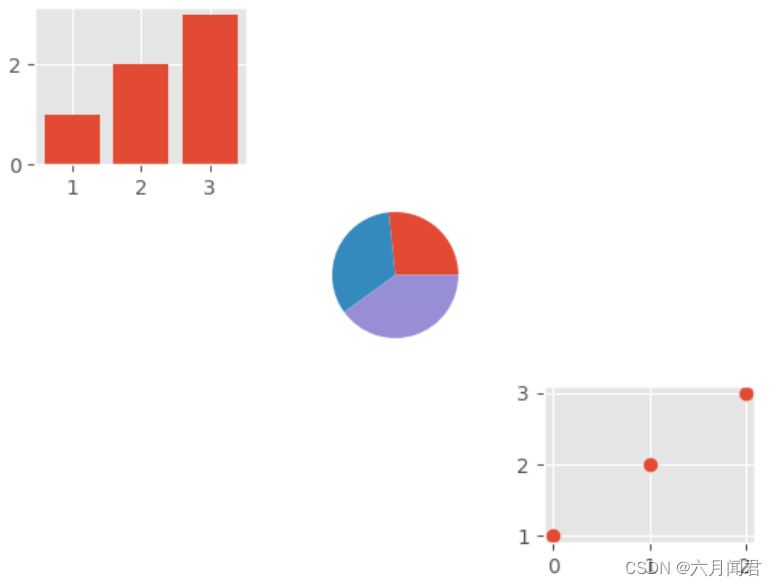
# 删除没有用到的子图
for i in range(3):
for j in range(3):
if i != j:
axes[i, j].remove()
plt.show()