DataFrame.plot函数详解(一)
第一部分主要介绍df.plot()函数的参数,特别是主要的配置参数,如linestyle ,画线的风格,各种类型的线定义;marker ,各类点的定义,圆形、方形、六边形、五边形 等;color 颜色的定义;loc 图示位置的定义。
1.函数定义
使用pandas.DataFrame的plot方法绘制图像会按照数据的每一列绘制一条曲线,默认按照列columns的名称在适当的位置展示图例 。
DataFrame.plot(x=None, y=None, kind='line', ax=None, subplots=False,
                sharex=None, sharey=False, layout=None, figsize=None,
                use_index=True, title=None, grid=None, legend=True,
                style=None, logx=False, logy=False, loglog=False,
                xticks=None, yticks=None, xlim=None, ylim=None, rot=None,
                fontsize=None, colormap=None, position=0.5, table=False, yerr=None,
                xerr=None, stacked=True/False, sort_columns=False,
                secondary_y=False, mark_right=True, **kwds)
1.1.参数说明
x和y:表示标签或者位置,用来指定显示的索引,默认为None
kind:表示绘图的类型,默认为line,折线图
   line:折线图
   bar/barh:柱状图(条形图),纵向/横向
   pie:饼状图 hist:直方图(数值频率分布) box:箱型图
   kde:密度图,主要对柱状图添加Kernel 概率密度线
   area:区域图(面积图)
   scatter:散点图 hexbin:蜂巢图
ax:子图,可以理解成第二坐标轴,默认None
subplots:是否对列分别作子图,默认False
sharex:共享x轴刻度、标签。如果ax为None,则默认为True,如果传入ax,则默认为False
sharey:共享y轴刻度、标签
layout:子图的行列布局,(rows, columns)
figsize:图形尺寸大小,(width, height)
use_index:用索引做x轴,默认True title:图形的标题
grid:图形是否有网格,默认None legend:子图的图例
style:对每列折线图设置线的类型,list or dict
logx:设置x轴刻度是否取对数,默认False
logy:设置y轴刻度是否取对数,默认False
loglog:同时设置x,y轴刻度是否取对数,默认False
xticks:设置x轴刻度值,序列形式(比如列表)
yticks:设置y轴刻度值,序列形式(比如列表)
xlim:设置x坐标轴的范围。数值,列表或元组(区间范围)
ylim:设置y坐标轴的范围。数值,列表或元组(区间范围)
rot:轴标签(轴刻度)的显示旋转度数,默认None
fontsize: int, default None#设置轴刻度的字体大小
colormap:设置图的区域颜色
colorbar:柱子颜色
position:柱形图的对齐方式,取值范围[0,1],默认0.5(中间对齐)
table:图下添加表,默认False。若为True,则使用DataFrame中的数据绘制表格
yerr:y误差线
xerr:x误差线
stacked:是否堆积,在折线图和柱状图中默认为False,在区域图中默认为True
sort_columns:对列名称进行排序,默认为False secondary_y:设置第二个y轴(右辅助y轴),默认为False
mark_right : 当使用secondary_y轴时,在图例中自动用“(right)”标记列标签 ,默认True
x_compat:适配x轴刻度显示,默认为False。设置True可优化时间刻度的显示
1.2.其他参数
color:颜色
s:散点图大小,int类型
#设置x,y轴名称
ax.set_ylabel('X')
ax.set_xlabel('Y')
1.3. 主要参数值
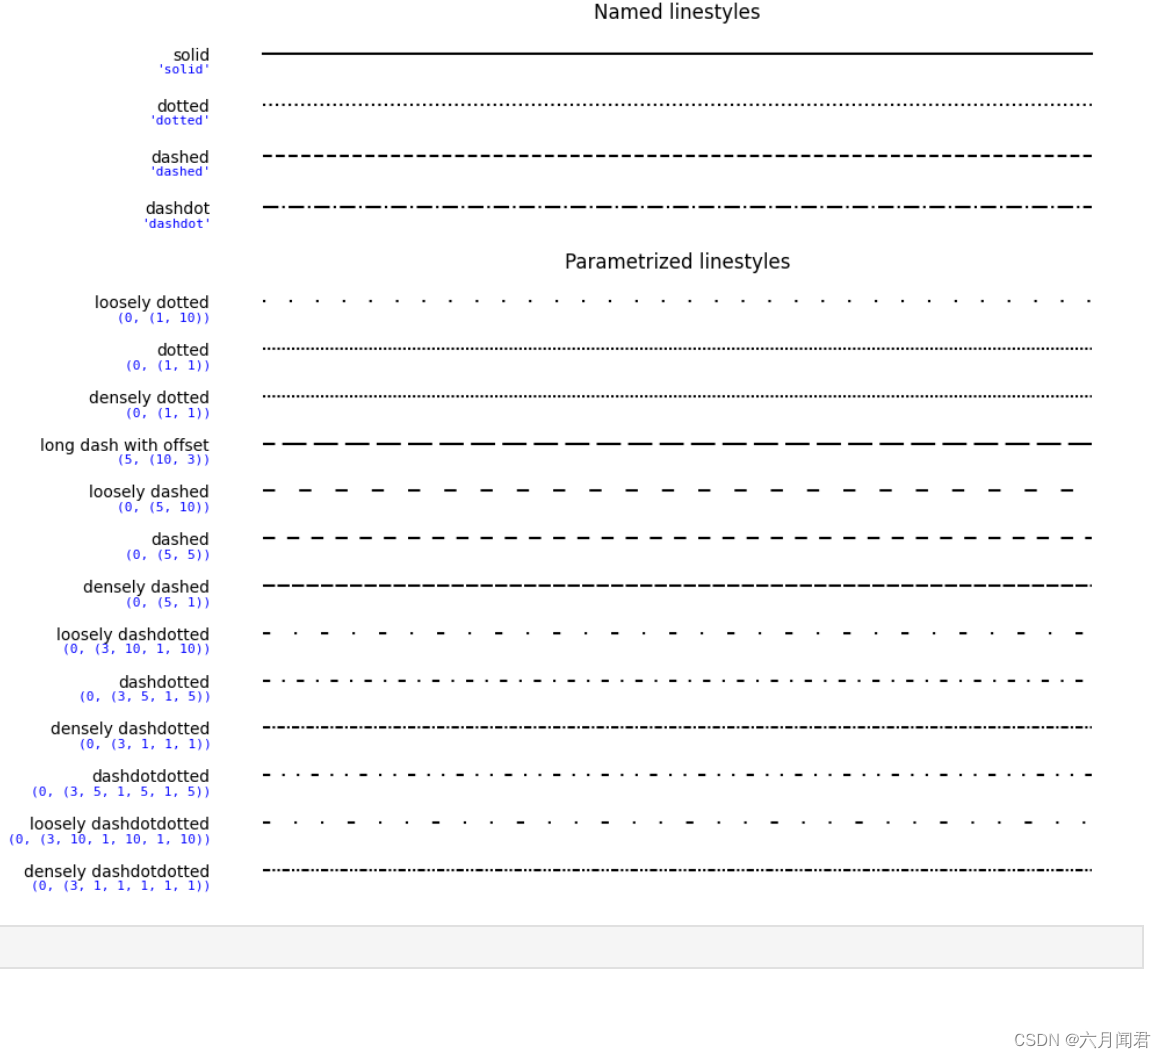
DataFrame的linestyle和marker参数,与matplotlib.pyplot的linestyle参数一样。
1.3.1. style
import numpy as np
import matplotlib.pyplot as plt

linestyle_str = [
     ('solid', 'solid'),      # Same as (0, ()) or '-'
     ('dotted', 'dotted'),    # Same as (0, (1, 1)) or ':'
     ('dashed', 'dashed'),    # Same as '--'
     ('dashdot', 'dashdot')]  # Same as '-.'

linestyle_tuple = [
     ('loosely dotted',        (0, (1, 10))),
     ('dotted',                (0, (1, 1))),
     ('densely dotted',        (0, (1, 1))),
     ('long dash with offset', (5, (10, 3))),
     ('loosely dashed',        (0, (5, 10))),
     ('dashed',                (0, (5, 5))),
     ('densely dashed',        (0, (5, 1))),
     ('loosely dashdotted',    (0, (3, 10, 1, 10))),
     ('dashdotted',            (0, (3, 5, 1, 5))),
     ('densely dashdotted',    (0, (3, 1, 1, 1))),
     ('dashdotdotted',         (0, (3, 5, 1, 5, 1, 5))),
     ('loosely dashdotdotted', (0, (3, 10, 1, 10, 1, 10))),
     ('densely dashdotdotted', (0, (3, 1, 1, 1, 1, 1)))]


def plot_linestyles(ax, linestyles, title):
    X, Y = np.linspace(0, 100, 10), np.zeros(10)
    yticklabels = []

    for i, (name, linestyle) in enumerate(linestyles):
        ax.plot(X, Y+i, linestyle=linestyle, linewidth=1.5, color='black')
        yticklabels.append(name)

    ax.set_title(title)
    ax.set(ylim=(-0.5, len(linestyles)-0.5),
           yticks=np.arange(len(linestyles)),
           yticklabels=yticklabels)
    ax.tick_params(left=False, bottom=False, labelbottom=False)
    ax.spines[:].set_visible(False)

    # For each line style, add a text annotation with a small offset from
    # the reference point (0 in Axes coords, y tick value in Data coords).
    for i, (name, linestyle) in enumerate(linestyles):
        ax.annotate(repr(linestyle),
                    xy=(0.0, i), xycoords=ax.get_yaxis_transform(),
                    xytext=(-6, -12), textcoords='offset points',
                    color="blue", fontsize=8, ha="right", family="monospace")


fig, (ax0, ax1) = plt.subplots(2, 1, figsize=(10, 8), height_ratios=[1, 3])

plot_linestyles(ax0, linestyle_str[::-1], title='Named linestyles')
plot_linestyles(ax1, linestyle_tuple[::-1], title='Parametrized linestyles')

plt.tight_layout()
plt.show()
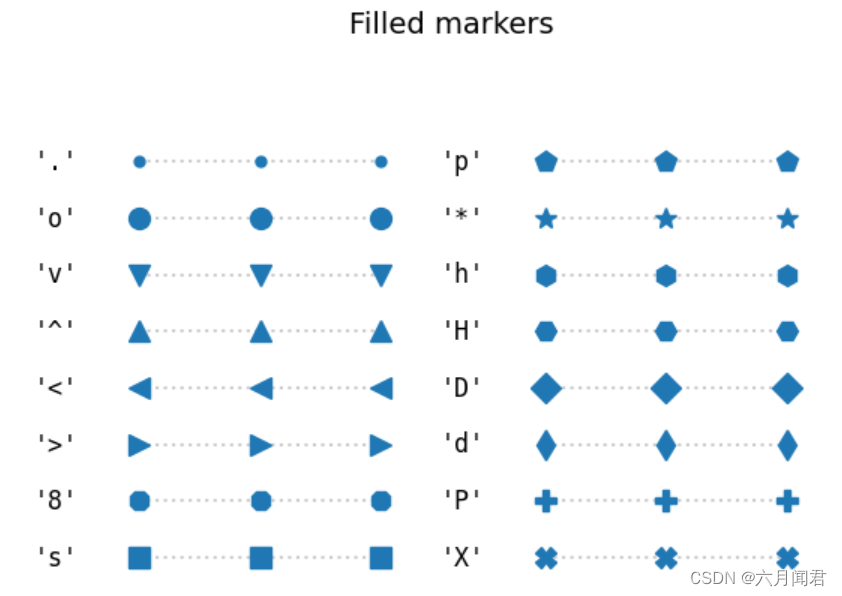
1.3.2. marker
from matplotlib.markers import MarkerStyle
import matplotlib.pyplot as plt
from matplotlib.lines import Line2D
from matplotlib.transforms import Affine2D


text_style = dict(horizontalalignment='right', verticalalignment='center',
                  fontsize=12, fontfamily='monospace')
marker_style = dict(linestyle=':', color='0.8', markersize=10,
                    markerfacecolor="tab:blue", markeredgecolor="tab:blue")


def format_axes(ax):
    ax.margins(0.2)
    ax.set_axis_off()
    ax.invert_yaxis()


def split_list(a_list):
    i_half = len(a_list) // 2
    return a_list[:i_half], a_list[i_half:]

fig, axs = plt.subplots(ncols=2)
fig.suptitle('Filled markers', fontsize=14)
for ax, markers in zip(axs, split_list(Line2D.filled_markers)):
    for y, marker in enumerate(markers):
        ax.text(-0.5, y, repr(marker), **text_style)
        ax.plot([y] * 3, marker=marker, **marker_style)
    format_axes(ax)
fig, axs = plt.subplots(ncols=2)
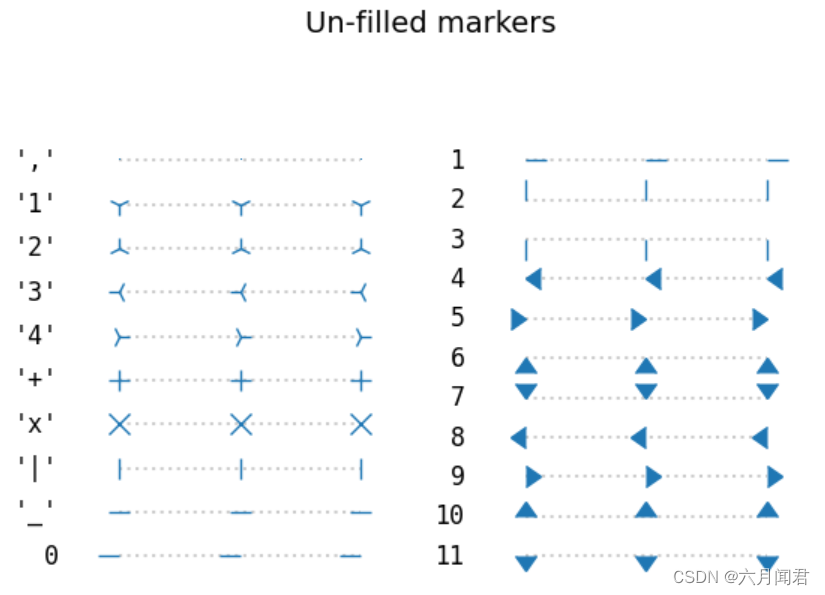
fig.suptitle('Un-filled markers', fontsize=14)
# Filter out filled markers and marker settings that do nothing.
unfilled_markers = [m for m, func in Line2D.markers.items()
if func != 'nothing' and m not in Line2D.filled_markers]
for ax, markers in zip(axs, split_list(unfilled_markers)):
for y, marker in enumerate(markers):
ax.text(-0.5, y, repr(marker), **text_style)
ax.plot([y] * 3, marker=marker, **marker_style)
format_axes(ax)
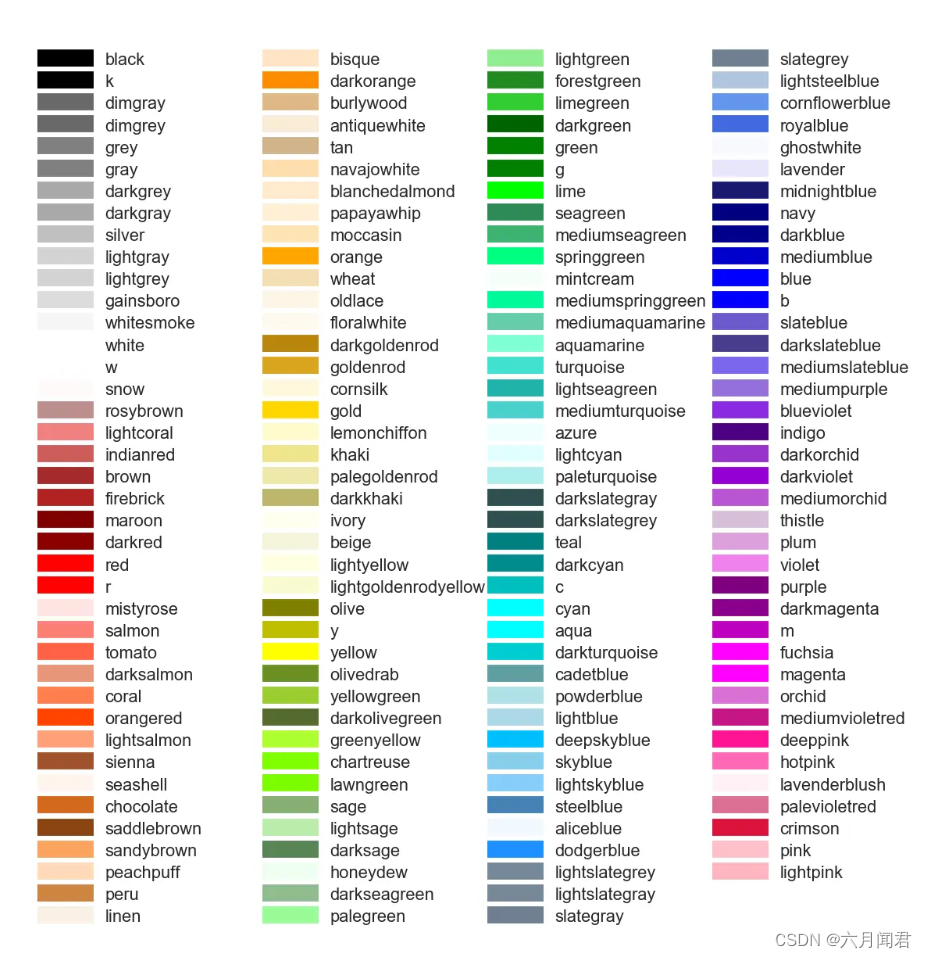
1.3.3 color
matplotlib定义的颜色
import matplotlib
matplotlib.colors.BASE_COLORS
matplotlib.colors.TABLEAU_COLORS
matplotlib.colors.CSS4_COLORS
matplotlib.colors.XKCD_COLORS
颜色展示如下:
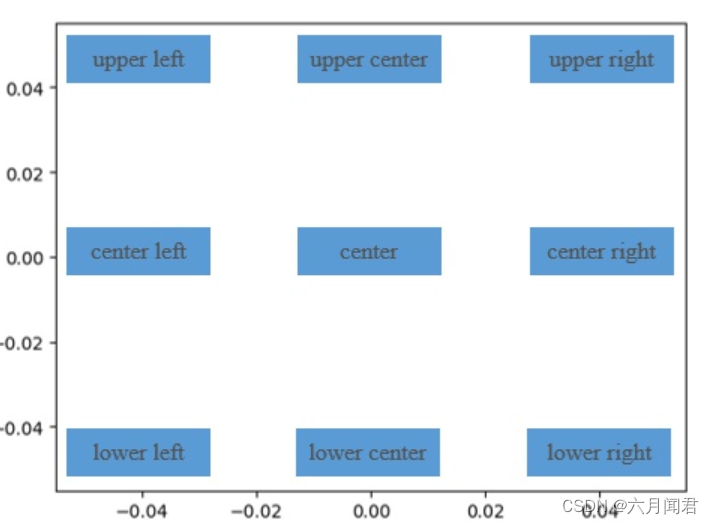
1.3.4 loc
loc用以控制图例在整个坐标平面的位置
第一种:loc = ‘best’
图例自动放在在一个坐标面内的数据图表最少的位置
第二种:loc =
upper left
upper center
upper right
center left
center
center right
lower left
lower center
lower right
代表了坐标面中的九个位置,例如loc = 'center’表示坐标平面中心位置,九种参数值及所对应位置如下图所示:
下一篇line函数,style 、marker、color、linewidth、markersize 、grid、xlim、ylim 、 loc 、subplot参数演示