版权声明:本文为博主原创文章,未经博主允许不得转载。 https://blog.csdn.net/brucewong0516/article/details/84241202
首先看官网的DataFrame.plot( )函数
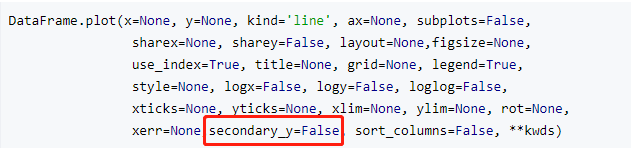
secondary_y : boolean or sequence, default False  # 可以是布尔值或者是数列
			  Whether to plot on the secondary y-axis
			  If a list/tuple, which columns to plot on secondary y-axis  # 如果是元组或者列表,则选定相应的column。
实例
# 定义一个随机的10行2列的df
df = pd.DataFrame(np.random.rand(10,2))

df
Out[78]:
          0         1
0  0.003266  0.185452
1  0.892003  0.911584
2  0.109250  0.322740
3  0.362998  0.374197
4  0.379907  0.166661
5  0.083620  0.460051
6  0.246119  0.732603
7  0.894286  0.265740
8  0.105298  0.027017
9  0.203045  0.232576

# 指定column = 1的列的轴为右轴的y轴
df.plot(secondary_y=[1])
Out[79]: <matplotlib.axes._subplots.AxesSubplot at 0x1cd7eb9e6a0>

选定部分columns到指定的轴

选定部分columns得到新的df,分别将选定的columns指定不同的索引

如果只是指定secondary_y为True,只是将右轴作为索引
