前端实现数据可视化的方案有很多种,以前都是使用百度的echarts,使用起来很方便,直接按照特定的数据格式输入,就能实现相应的效果,虽然使用方便,但是缺点就是无法自定义一些事件操作,可自由发挥的功能很少,对于一些特殊要求的需求就无能为力了,而d3.js很好地解决了这个问题;
1、安装d3
npm install d3 --save
2、安装d3-sankey
npm install d3-sankey --save
3、引入对应的模块
import * as d3 from 'd3'
import * as d3Sankey from 'd3-sankey'
4、桑基图核心代码实现
methods: {
        initHandle() {
            let data = [
                {
                    Survived: "Perished",
                    Sex: "Male",
                    Age: "Child",
                    Class: "Second Class",
                    value: 67
                },
                {
                    Survived: "Perished",
                    Sex: "Male",
                    Age: "Adult",
                    Class: "Crew",
                    value: 270
                },
                {
                    Survived: "Perished",
                    Sex: "Male",
                    Age: "Adult",
                    Class: "Crew",
                    value: 170
                },
                {
                    Survived: "Perished",
                    Sex: "Male",
                    Age: "Child",
                    Class: "Crew",
                    value: 610
                },
                {
                    Survived: "Perished",
                    Sex: "Male",
                    Age: "Adult",
                    Class: "Second Class",
                    value: 870
                },
                {
                    Survived: "Perished",
                    Sex: "Male",
                    Age: "Adult",
                    Class: "Crew",
                    value: 1670
                },
                {
                    Survived: "Perished",
                    Sex: "Male",
                    Age: "Child",
                    Class: "Crew",
                    value: 6370
                },
                {
                    Survived: "Perished",
                    Sex: "Male",
                    Age: "Adult",
                    Class: "Crew",
                    value: 10
                },
                {
                    Survived: "Perished",
                    Sex: "Male",
                    Age: "Adult",
                    Class: "Crew",
                    value: 370
                }
            ]

            data['columns'] = [
                "Survived",
                "Sex",
                "Age",
                "Class",
                "value"
            ]

            const keys = data.columns.slice(0, -1)

            const sankey = d3Sankey.sankey()
                .nodeSort(null)
                .linkSort(null)
                .nodeWidth(4)
                .nodePadding(20)
                .extent([[0, 5], [this.width, this.height - 5]])

            function graph() {
                let index = -1;
                const nodes = [];
                const nodeByKey = new Map;
                const indexByKey = new Map;
                const links = [];

                for (const k of keys) {
                    for (const d of data) {
                        const key = JSON.stringify([k, d[k]]);
                        if (nodeByKey.has(key)) continue;
                        const node = {name: d[k]};
                        nodes.push(node);
                        nodeByKey.set(key, node);
                        indexByKey.set(key, ++index);
                    }
                }

                for (let i = 1; i < keys.length; ++i) {
                    const a = keys[i - 1];
                    const b = keys[i];
                    const prefix = keys.slice(0, i + 1);
                    const linkByKey = new Map;
                    for (const d of data) {
                        const names = prefix.map(k => d[k]);
                        const key = JSON.stringify(names);
                        const value = d.value || 1;
                        let link = linkByKey.get(key);
                        if (link) { link.value += value; continue; }
                        link = {
                            source: indexByKey.get(JSON.stringify([a, d[a]])),
                            target: indexByKey.get(JSON.stringify([b, d[b]])),
                            names,
                            value
                        };
                        links.push(link);
                        linkByKey.set(key, link);
                    }
                }

                return {nodes, links};
            }

            const color = d3.scaleOrdinal(["Perished"], ["#da4f81"]).unknown("#ccc")

            const svg = d3.select("#box")
                .append('svg')
                .attr("width", this.width)
                .attr("height", this.height);

            const {nodes, links} = sankey({
                nodes: graph().nodes.map(d => Object.assign({}, d)),
                links: graph().links.map(d => Object.assign({}, d))
            });

            svg.append("g")
                .selectAll("rect")
                .data(nodes)
                .join("rect")
                .attr("x", d => d.x0)
                .attr("y", d => d.y0)
                .attr("height", d => d.y1 - d.y0)
                .attr("width", d => d.x1 - d.x0)
                .append("title")
                .text(d => `${d.name}\n${d.value.toLocaleString()}`);

            svg.append("g")
                .attr("fill", "none")
                .selectAll("g")
                .data(links)
                .join("path")
                .attr("d", d3Sankey.sankeyLinkHorizontal())
                .attr("stroke", d => color(d.names[0]))
                .attr("stroke-width", d => d.width)
                .style("mix-blend-mode", "multiply")
                .append("title")
                .text(d => `${d.names.join(" → ")}\n${d.value.toLocaleString()}`);

            svg.append("g")
                .style("font", "10px sans-serif")
                .selectAll("text")
                .data(nodes)
                .join("text")
                .attr("x", d => d.x0 < this.width / 2 ? d.x1 + 6 : d.x0 - 6)
                .attr("y", d => (d.y1 + d.y0) / 2)
                .attr("dy", "0.35em")
                .attr("text-anchor", d => d.x0 < this.width / 2 ? "start" : "end")
                .text(d => d.name)
                .append("tspan")
                .attr("fill-opacity", 0.7)
                .text(d => ` ${d.value.toLocaleString()}`);

            return svg.node();
        }
    }
其中的data数据暂时为固定数据,实际开发中可以调取后台接口获取。
html部分为:
<template>
    <div class="app-container">
        <div id="box"></div>
    </div>
</template>
5、预览效果
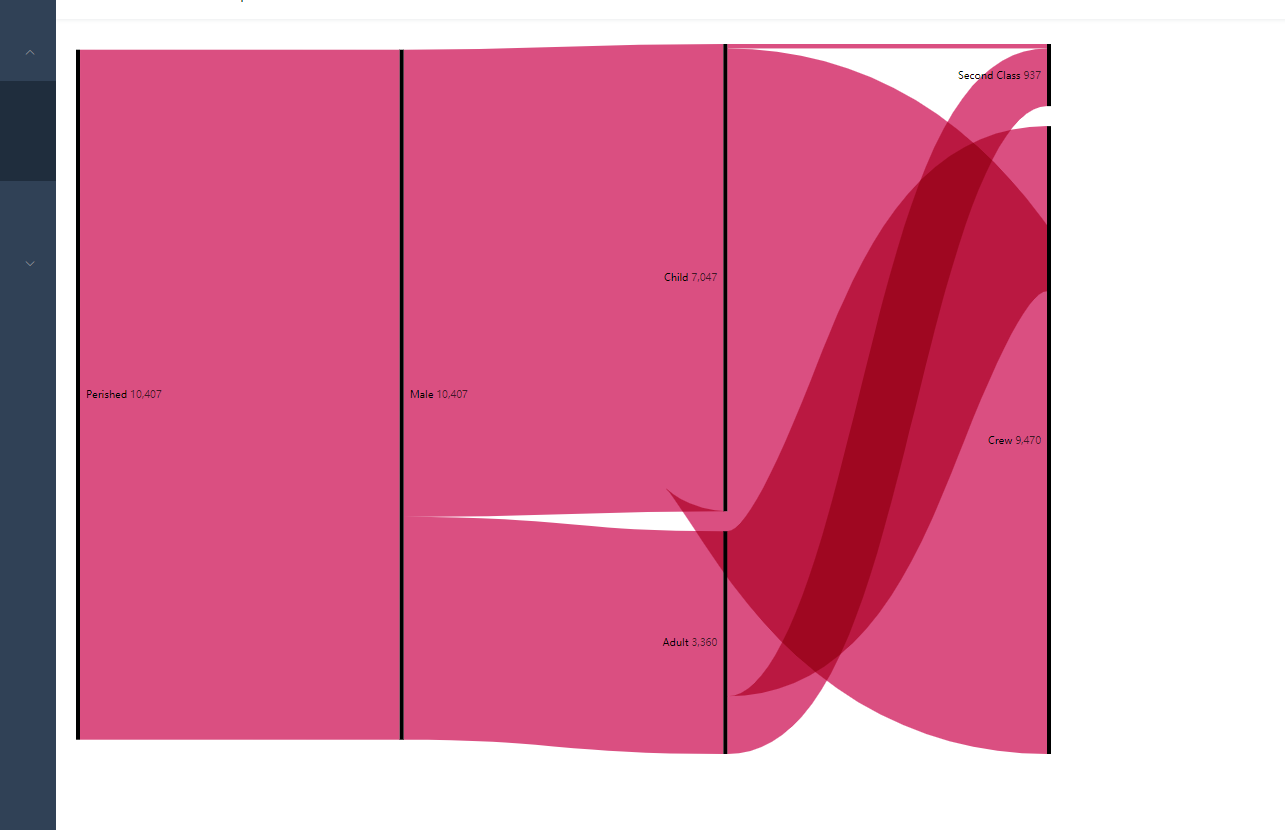
后续可封装为通用组件,只需传入数据即可实现效果~~~