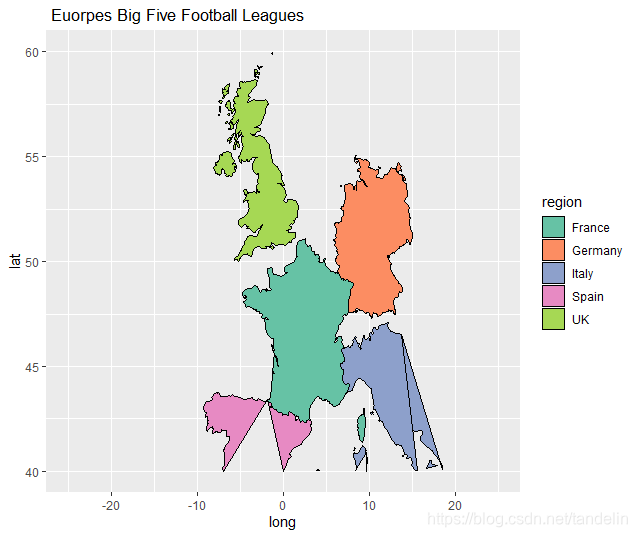
绘制世界指定区域的地图数据
#install.packages("maps")
library(maps)
library(ggplot2)
world_map <- map_data("world")
euro <- map_data("world", region = c("UK","France", "Spain","Germany", "Italy"))
ggplot(euro, aes(x=long, y = lat, group=group,fill=region)) + geom_polygon(colour="black") + scale_fill_brewer(palette = "Set2") + scale_y_continuous(limits=c(40,60)) + scale_x_continuous(limits=c(-25,25)) + labs(title = " Euorpes Big Five Football Leagues")
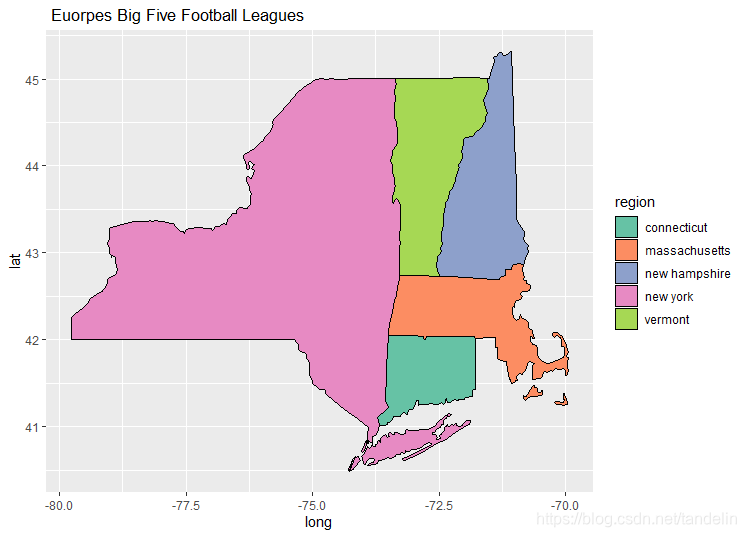
美国省份地图绘制
安装包准备
#install.packages(“maps”)
library(maps)
library(ggplot2)
调出美国的国家地图
states_map <- map_data(“state”)
查看美国国家地图数据的区域
table(states_map$region)
提取美国国家地图省份的数据
euro <- map_data(“state”, region = c(“new york”,“vermont”,
“new hampshire”,“massachusetts”, “connecticut”))
ggplot绘制省份地图的数据
ggplot(euro, aes(x=long, y = lat, group=group,fill=region)) +
geom_polygon(colour=“black”) +
scale_fill_brewer(palette = “Set2”) +
labs(title = " Euorpes Big Five Football Leagues")
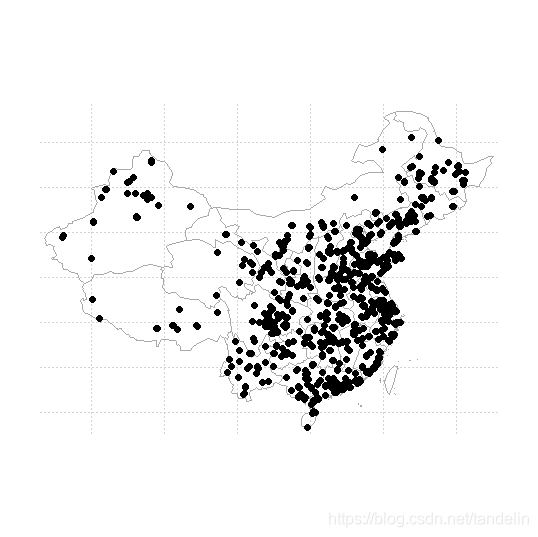
中国省份地图绘制
library ( maps )
library ( mapdata )
setwd("C:\\Users\\Administrator\\Desktop\\map")
data=read_excel("PMDiff2017.xlsx")
map ( "china" , col = "darkgray" , ylim = c ( 18 , 54 ) , panel.first = grid ( ) )
points ( data$slon , data$slat, pch = 19 , col = rgb ( 0 , 0 , 0 , 0.5 ) )