前文回顾:
PySpark与GraphFrames的安装与使用
https://xxmdmst.blog.csdn.net/article/details/123009617networkx快速解决连通图问题
https://xxmdmst.blog.csdn.net/article/details/123012333
前面我讲解了PySpark图计算库的使用以及纯python解决连通图问题的两个示例。这篇文章我们继续对上次的连通图问题改用PySpark实现。
需求1:找社区
刘备和关羽有关系,说明他们是一个社区,刘备和张飞也有关系,那么刘备、关羽、张飞归为一个社区,以此类推。
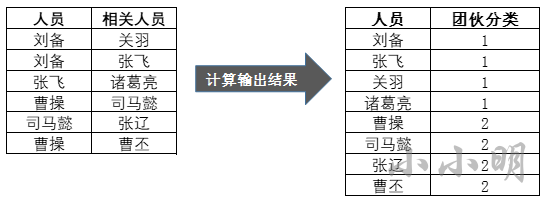
对于这个连通图问题使用Pyspark如何解决呢?
首先,我们创建spark对象:
from pyspark.sql import SparkSession, Row
from graphframes import GraphFrame

spark = SparkSession \
    .builder \
    .appName("PySpark") \
    .master("local[*]") \
    .getOrCreate()
sc = spark.sparkContext
# 设置检查点目录
sc.setCheckpointDir("checkpoint")
然后构建数据:
data = [
    ['刘备', '关羽'],
    ['刘备', '张飞'],
    ['张飞', '诸葛亮'],
    ['曹操', '司马懿'],
    ['司马懿', '张辽'],
    ['曹操', '曹丕']
]
data = spark.createDataFrame(data, ["人员", "相关人员"])
data.show()
+------+--------+
|  人员|相关人员|
+------+--------+
|  刘备|    关羽|
|  刘备|    张飞|
|  张飞|  诸葛亮|
|  曹操|  司马懿|
|司马懿|    张辽|
|  曹操|    曹丕|
+------+--------+
很明显原始数据就是图计算所要求的边数据,只修改一下列名即可:
edges = data.toDF("src", "dst")
edges.printSchema()
root
 |-- src: string (nullable = true)
 |-- dst: string (nullable = true)
下面我们开始构建顶点数据:
vertices = (
    edges.rdd.flatMap(lambda x: x)
            .distinct()
            .map(lambda x: Row(x))
            .toDF(["id"])
)
vertices.show()
+------+
|    id|
+------+
|诸葛亮|
|  刘备|
|  曹操|
|司马懿|
|  曹丕|
|  关羽|
|  张飞|
|  张辽|
+------+
下面使用spark的图计算 计算连通图:
g = GraphFrame(vertices, edges)
result = g.connectedComponents().orderBy("component")
result.show()
+------+------------+
|    id|   component|
+------+------------+
|司马懿|           0|
|  张辽|           0|
|  曹丕|           0|
|  曹操|           0|
|  关羽|635655159808|
|  刘备|635655159808|
|  张飞|635655159808|
|诸葛亮|635655159808|
+------+------------+
可以看到结果中已经顺利将一个社区的成员通过一个相同的component标识出来,成功解决需求。
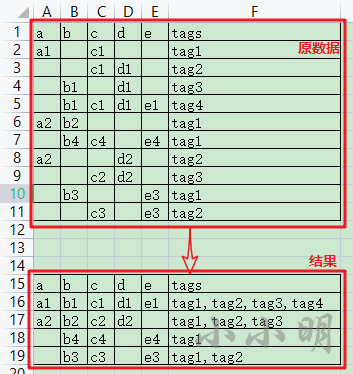
需求2:统一用户识别
abcde这5个字段表示mac地址,ip地址,device_id,imei等唯一标识,tags表示用户的标签。由于某些原因,同一用户的唯一标识字段总是有几个字段存在缺失,现在要求将同一个用户的数据都能识别出来,同时将每个用户的标签进行合并。原始数据和结果模型示例如下:
首先,我们构建数据:
df = spark.createDataFrame([
    ['a1', None, 'c1', None, None, 'tag1'],
    [None, None, 'c1', 'd1', None, 'tag2'],
    [None, 'b1', None, 'd1', None, 'tag3'],
    [None, 'b1', 'c1', 'd1', 'e1', 'tag4'],
    ['a2', 'b2', None, None, None, 'tag1'],
    [None, 'b4', 'c4', None, 'e4', 'tag1'],
    ['a2', None, None, 'd2', None, 'tag2'],
    [None, None, 'c2', 'd2', None, 'tag3'],
    [None, 'b3', None, None, 'e3', 'tag1'],
    [None, None, 'c3', None, 'e3', 'tag2'],
], list("abcde")+["tags"])
df.show()
结果:
+----+----+----+----+----+----+
|   a|   b|   c|   d|   e|tags|
+----+----+----+----+----+----+
|  a1|null|  c1|null|null|tag1|
|null|null|  c1|  d1|null|tag2|
|null|  b1|null|  d1|null|tag3|
|null|  b1|  c1|  d1|  e1|tag4|
|  a2|  b2|null|null|null|tag1|
|null|  b4|  c4|null|  e4|tag1|
|  a2|null|null|  d2|null|tag2|
|null|null|  c2|  d2|null|tag3|
|null|  b3|null|null|  e3|tag1|
|null|null|  c3|null|  e3|tag2|
+----+----+----+----+----+----+
接下来的思路依然跟上次一样,首先为每一行数据分配一个唯一id,然后对每个唯一标识的列,根据是否一样构建行与行之间的连接关系,所有的唯一标识列产生的连接关系共同作为图计算的边。
下面使用RDD的zipWithUniqueId方法为每一行产生一个唯一ID,并将这个ID移动到最前(由于这个数据后面可能会多次被频繁使用所以缓存起来):
tmp = df.rdd.zipWithUniqueId().map(lambda x: (x[1], x[0]))
tmp.cache()
tmp.first()
(0, Row(a='a1', b=None, c='c1', d=None, e=None, tags='tag1'))
根据唯一id构建顶点数据:
vertices = tmp.map(lambda x: Row(x[0])).toDF(["id"])
vertices.show()
+---+
| id|
+---+
|  0|
|  1|
|  7|
|  2|
|  8|
|  3|
|  4|
| 10|
|  5|
| 11|
+---+
接下来,构建边数据:
def func(p):
    for k, ids in p:
        ids = list(ids)
        n = len(ids)
        if n <= 1:
            continue
        for i in range(n-1):
            for j in range(i+1, n):
                yield (ids[i], ids[j])


edges = []
keylist = list("abcde")
for key in keylist:
    data = tmp.mapPartitions(lambda area: [(row[key], i) for i, row in area if row[key]])
    edgeRDD = data.groupByKey().mapPartitions(func)
    edges.append(edgeRDD)
edgesDF = sc.union(edges).toDF(["src", "dst"])
edgesDF.cache()
edgesDF.show()
+---+---+
|src|dst|
+---+---+
|  8|  4|
|  7|  2|
|  0|  1|
|  0|  2|
|  1|  2|
|  4| 10|
|  1|  7|
|  1|  2|
|  7|  2|
|  5| 11|
+---+---+
可以看到所有的行号关系已经被成功获取。
下面使用图计算 计算出属于同一用户的行:
gdf = GraphFrame(vertices, edgesDF)
components = gdf.connectedComponents()
components.show()
+---+---------+
| id|component|
+---+---------+
|  0|        0|
|  1|        0|
|  7|        0|
|  2|        0|
|  8|        4|
|  3|        3|
|  4|        4|
| 10|        4|
|  5|        5|
| 11|        5|
+---+---------+
有了行号和所归属的组唯一标识,我们可以通过表连接获取原始数据的每一行所归属的component:
result = tmp.cogroup(components.rdd) \
    .map(lambda pair: pair[1][0].data[0] + Row(pair[1][1].data[0])) \
    .toDF(df.schema.names+["component"])
result.cache()
result.show()
+----+----+----+----+----+----+---------+
|   a|   b|   c|   d|   e|tags|component|
+----+----+----+----+----+----+---------+
|  a1|null|  c1|null|null|tag1|        0|
|null|null|  c1|  d1|null|tag2|        0|
|null|  b1|  c1|  d1|  e1|tag4|        0|
|null|  b4|  c4|null|  e4|tag1|        3|
|  a2|null|null|  d2|null|tag2|        4|
|null|  b3|null|null|  e3|tag1|        5|
|null|  b1|null|  d1|null|tag3|        0|
|  a2|  b2|null|null|null|tag1|        4|
|null|null|  c2|  d2|null|tag3|        4|
|null|null|  c3|null|  e3|tag2|        5|
+----+----+----+----+----+----+---------+
可以看到我们已经成功的进行同一用户识别了,剩下的只需要分组并使用pandas的逻辑合并数据:
def func(pdf):
    row = pdf[keylist].bfill().head(1)
    row["tags"] = pdf.tags.str.cat(sep=",")
    return row


result.groupBy("component").applyInPandas(
    func, schema="a string, b string, c string, d string, e string, tags string"
).show()
+----+---+---+----+----+-------------------+
|   a|  b|  c|   d|   e|               tags|
+----+---+---+----+----+-------------------+
|  a1| b1| c1|  d1|  e1|tag1,tag2,tag4,tag3|
|null| b4| c4|null|  e4|               tag1|
|  a2| b2| c2|  d2|null|     tag2,tag1,tag3|
|null| b3| c3|null|  e3|          tag1,tag2|
+----+---+---+----+----+-------------------+
可以看到已经顺利得到需要的结果。
注意:applyInPandas要求返回的结果必须是pandas的datafream对象,所以相对之前的逻辑由.iloc[0]改成了.head(1)
如果你的spark不是3.X版本,没有applyInPandas方法,用原生rdd的方法则会麻烦很多:
def func(pair):
    component, rows = pair
    keyList = list("abcde")
    ids = {

    }
    for row in rows:
        for key in keylist:
            v = getattr(row, key)
            if v:
                ids[key] = v
        ids.setdefault("tags", []).append(row.tags)
    result = []
    for key in keylist:
        result.append(ids.get(key))
    result.append(",".join(ids["tags"]))
    return result


result2 = result.rdd.groupBy(
    lambda row: row.component).map(func).toDF(df.schema)
result2.cache()
result2.show()
结果也一样:
+----+---+---+----+----+-------------------+
|   a|  b|  c|   d|   e|               tags|
+----+---+---+----+----+-------------------+
|  a1| b1| c1|  d1|  e1|tag1,tag2,tag4,tag3|
|null| b4| c4|null|  e4|               tag1|
|  a2| b2| c2|  d2|null|     tag2,tag1,tag3|
|null| b3| c3|null|  e3|          tag1,tag2|
+----+---+---+----+----+-------------------+