注1:本文系“简要介绍”系列之一,仅从概念上对巴特沃斯滤波器进行非常简要的介绍,不适合用于深入和详细的了解。
简要介绍 | 巴特沃斯滤波器:理论与应用
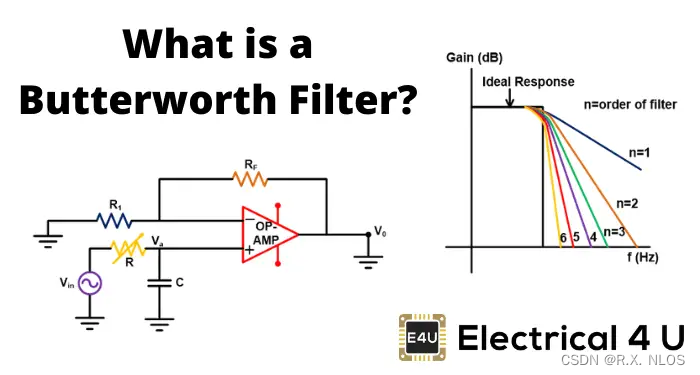
Butterworth Filter: What is it? (Design & Applications) | Electrical4U
1 背景介绍
在信号处理领域,滤波器是一种非常重要的工具,用于剔除噪声、提取特征等。滤波器有许多种类型,其中 巴特沃斯滤波器(Butterworth Filter) 是一种广泛应用的滤波器,因其具有平滑的频率响应、无纹波等优点而受到工程师们的青睐。
2 原理介绍和推导
2.1. 巴特沃斯滤波器的特点
巴特沃斯滤波器主要有以下特点:
- 无纹波:在通带和阻带内,巴特沃斯滤波器的幅频响应曲线没有波动。
- 频率响应平滑:巴特沃斯滤波器的幅频响应曲线平滑且单调,对频率变化具有良好的适应性。
2.2. 巴特沃斯滤波器的数学推导
巴特沃斯滤波器的传递函数为:
H ( j ω ) = 1 1 + ( j ω ω c ) 2 n H(j\omega) = \frac{1}{\sqrt{1 + (\frac{j\omega}{\omega_c})^{2n}}} H(jω)=1+(ωcjω)2n1
其中, n n n 是 滤波器阶数 , ω c \omega_c ωc 是 截止频率 , j j j 是复数单位。
根据传递函数,我们可以得到巴特沃斯滤波器的幅频响应:
∣ H ( j ω ) ∣ = 1 1 + ( ω ω c ) 2 n |H(j\omega)| = \frac{1}{\sqrt{1 + (\frac{\omega}{\omega_c})^{2n}}} ∣H(jω)∣=1+(ωcω)2n1
当 n n n 逐渐增大时,巴特沃斯滤波器的阻带衰减变得越来越陡峭。
3 研究现状
巴特沃斯滤波器的研究已经有很长的历史,目前其应用领域包括 通信 、 图像处理 、 生物医学 等。在这些领域,巴特沃斯滤波器可以帮助实现信号的去噪、特征提取等功能。
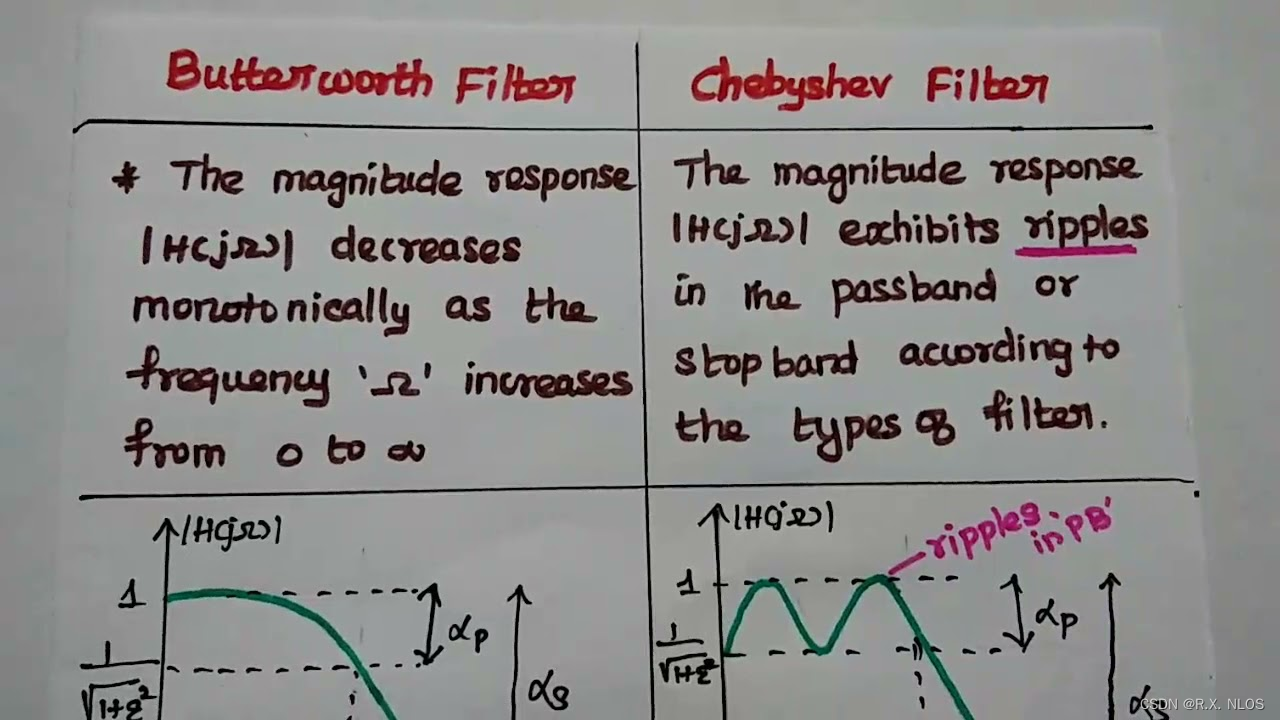
Comparison of Butterworth Filter and Chebyshev Filter - Analog Filter Design - DTSP - DSP
4 挑战
尽管巴特沃斯滤波器具有一定的优点,但在实际应用中仍然存在一些挑战:
1.相位延迟:巴特沃斯滤波器在处理信号时,不同频率的信号会出现不同的相位延迟,可能导致信号失真。
2. 设计复杂度:高阶巴特沃斯滤波器的设计和实现较为复杂,可能增加系统成本。
5 未来展望
随着科学技术的不断发展,巴特沃斯滤波器的应用领域将不断拓展。研究者们还将继续探索新的滤波算法,以解决巴特沃斯滤波器在实际应用中遇到的挑战。
6 代码示例
以下是一个使用 Python 和 SciPy 库实现的巴特沃斯滤波器示例:
import numpy as np
import matplotlib.pyplot as plt
from scipy.signal import butter, lfilter, freqz

def butter_lowpass(cutoff, fs, order=5):
    nyq = 0.5 * fs
    normal_cutoff = cutoff / nyq
    b, a = butter(order, normal_cutoff, btype='low', analog=False)
    return b, a

def butter_lowpass_filter(data, cutoff, fs, order=5):
    b, a = butter_lowpass(cutoff, fs, order=order)
    y = lfilter(b, a, data)
    return y

# Sample data
fs = 5000.0       # sample rate, Hz
T = 0.05           # duration, s
n = int(T * fs)    # total number of samples
t = np.linspace(0, T, n, endpoint=False)
data = np.sin(1.2 * 2 * np.pi * t) + 1.5 * np.cos(9 * 2 * np.pi * t) + 0.5 * np.sin(12.0 * 2 * np.pi * t)

# Filter requirements
order = 6
cutoff = 3.667  # desired cutoff frequency, Hz

# Filtering the data
filtered_data = butter_lowpass_filter(data, cutoff, fs, order)

# Visualization
plt.plot(t, data, 'b-', label='data')
plt.plot(t, filtered_data, 'g-', linewidth=2, label='filtered data')
plt.legend()
plt.grid()
plt.show()
通过上述代码,我们可以实现一个简单的巴特沃斯低通滤波器,并在示例数据上进行滤波操作。
7 实例:如何根据目标频率范围设计巴特沃斯带通滤波器,并用Python实现
在本节中,我们将介绍如何根据目标频率范围设计巴特沃斯带通滤波器,并使用 Python 进行实现。
7.1. 巴特沃斯带通滤波器的设计方法
要设计一个巴特沃斯带通滤波器,我们需要首先确定如下参数:
- 滤波器阶数:滤波器的阶数决定了频率响应的陡峭程度。阶数越高,频率响应越陡峭。
- 通带下截止频率:通带下截止频率决定了滤波器的通带下边界。
- 通带上截止频率:通带上截止频率决定了滤波器的通带上边界。
确定了这些参数后,我们可以利用 SciPy 库中的 butter 函数设计巴特沃斯带通滤波器。
7.2. 使用 Python 实现巴特沃斯带通滤波器
下面是一个使用 Python 和 SciPy 库实现的巴特沃斯带通滤波器示例:
import numpy as np
import matplotlib.pyplot as plt
from scipy.signal import butter, lfilter, freqz

def butter_bandpass(lowcut, highcut, fs, order=5):
    nyq = 0.5 * fs
    low = lowcut / nyq
    high = highcut / nyq
    b, a = butter(order, [low, high], btype='band', analog=False)
    return b, a

def butter_bandpass_filter(data, lowcut, highcut, fs, order=5):
    b, a = butter_bandpass(lowcut, highcut, fs, order=order)
    y = lfilter(b, a, data)
    return y

# Sample data
fs = 5000.0       # sample rate, Hz
T = 0.05           # duration, s
n = int(T * fs)    # total number of samples
t = np.linspace(0, T, n, endpoint=False)
data = np.sin(1.2 * 2 * np.pi * t) + 1.5 * np.cos(9 * 2 * np.pi * t) + 0.5 * np.sin(12.0 * 2 * np.pi * t)

# Filter requirements
order = 6
lowcut = 2.0   # desired lower cutoff frequency, Hz
highcut = 10.0  # desired upper cutoff frequency, Hz

# Filtering the data
filtered_data = butter_bandpass_filter(data, lowcut, highcut, fs, order)

# Visualization
plt.plot(t, data, 'b-', label='data')
plt.plot(t, filtered_data, 'g-', linewidth=2, label='filtered data')
plt.legend()
plt.grid()
plt.show()
通过上述代码,我们可以实现一个简单的巴特沃斯带通滤波器,并在示例数据上进行滤波操作。根据不同的目标频率范围,我们可以通过调整 lowcut 和 highcut 参数来设计不同的带通滤波器。