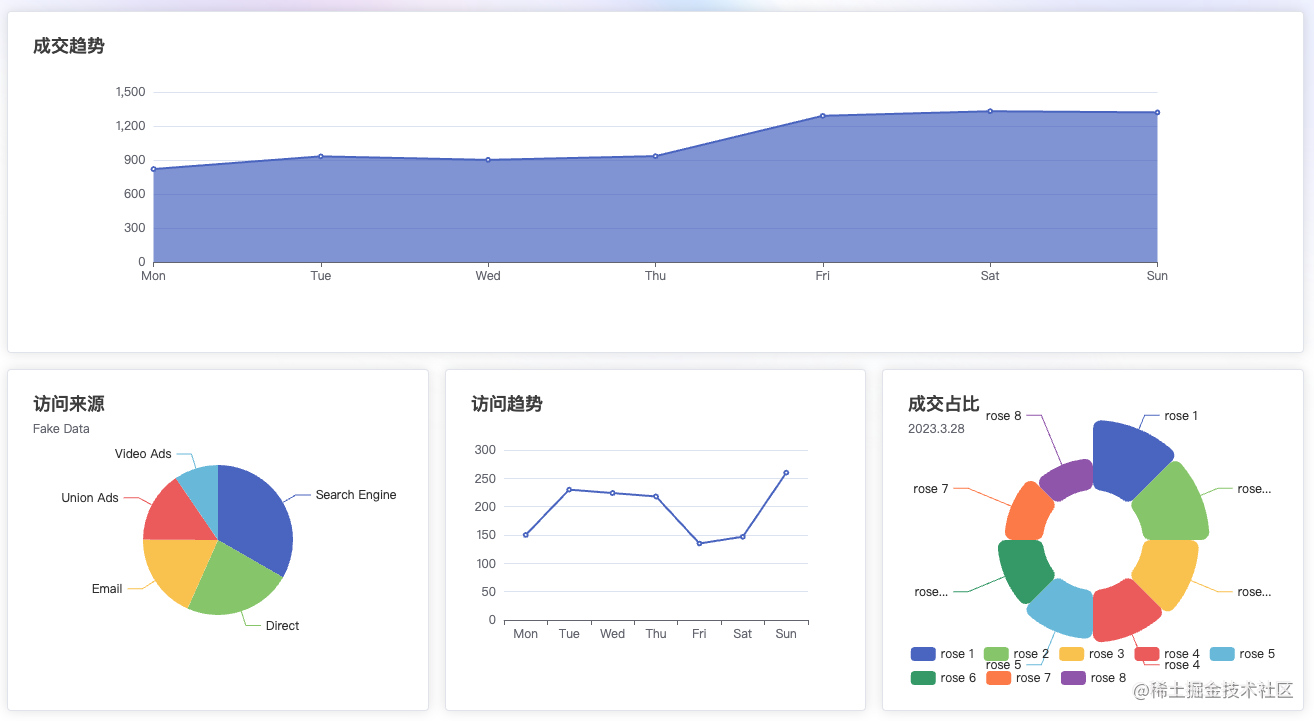
图表统计作为后台管理系统标配当然不能少,本项目选择使用最熟悉的eCharts。
eCharts完整包太大了,一般项目中只会使用其中小部分图表,所以我们只用按需引入,尽量减少打包体积。
首先安装eCharts
npm install echarts --save
在src/components 文件夹下新建目录echarts,新建文件echarts.ts。
本项目只简单使用了eChart的几个基本图表,如果你的需求比较复杂需要更多图表组件,可以修改echarts.ts中引入的组件
import * as echarts from 'echarts/core'

/**
引入需要的图表,需要什么就加什么
*/
import {

     BarChart, LineChart, PieChart } from 'echarts/charts'

// 引入提示框,标题,直角坐标系,数据集,内置数据转换器组件,组件后缀都为 Component
import {


  TitleComponent,
  TooltipComponent,
  GridComponent,
  DatasetComponent,
  TransformComponent,
  LegendComponent,
  ToolboxComponent
} from 'echarts/components'

// 标签自动布局,全局过渡动画等特性
import {

     LabelLayout, UniversalTransition } from 'echarts/features'

// 引入 Canvas 渲染器,注意引入 CanvasRenderer 或者 SVGRenderer 是必须的一步
import {

     CanvasRenderer } from 'echarts/renderers'

// 注册必须的组件,上面引入的都需要在此注册
echarts.use([
  ToolboxComponent,
  LegendComponent,
  TitleComponent,
  TooltipComponent,
  GridComponent,
  DatasetComponent,
  TransformComponent,
  LabelLayout,
  UniversalTransition,
  CanvasRenderer,
  BarChart,
  LineChart,
  PieChart
])

// 导出
export default echarts
在scr/components/echarts文件夹中,新建MyEchart.vue
<template>
  <div ref="chartRef" class="my-chart"></div>
</template>

<script setup lang="ts">
import {

      onBeforeUnmount, onMounted, ref } from 'vue'
import echarts from './echarts'

const props = defineProps(['options'])
const chartRef = ref<HTMLDivElement>()
let chart: echarts.ECharts | null = null
const resizeHandler = () => {


  chart?.resize()
}
onMounted(() => {


  setTimeout(() => {


    initChart()
  }, 20)
  window.addEventListener('resize', resizeHandler)
})

const initChart = () => {


  chart = echarts.init(chartRef.value as HTMLDivElement)
  chart.setOption({


    ...props.options
  })
}

onBeforeUnmount(() => {


  window.removeEventListener('resize', resizeHandler)
  chart?.dispose()
})
</script>

<style lang="scss" scoped></style>
因为本项目使用了unplugin-vue-components,所以在页面中可以直接使用新建的MyEchart组件,以下代码实现了一个简单的饼图
<template>
  <MyEchart :options="options" style="height: 300px"></MyEchart>
</template>

<script setup lang="ts">
import {

     reactive } from 'vue'
import MyEchart from '~/components/echarts/MyEchart.vue'

const options = reactive({


  title: {


    text: '访问来源',
    subtext: 'Fake Data',
    left: 'left'
  },
  tooltip: {


    trigger: 'item'
  },

  series: [
    {


      name: 'Access From',
      type: 'pie',
      radius: '50%',
      data: [
        {

     value: 1048, name: 'Search Engine' },
        {

     value: 735, name: 'Direct' },
        {

     value: 580, name: 'Email' },
        {

     value: 484, name: 'Union Ads' },
        {

     value: 300, name: 'Video Ads' }
      ],
      emphasis: {


        itemStyle: {


          shadowBlur: 10,
          shadowOffsetX: 0,
          shadowColor: 'rgba(0, 0, 0, 0.5)'
        }
      }
    }
  ]
})
</script>