非监督学习:聚类、降维
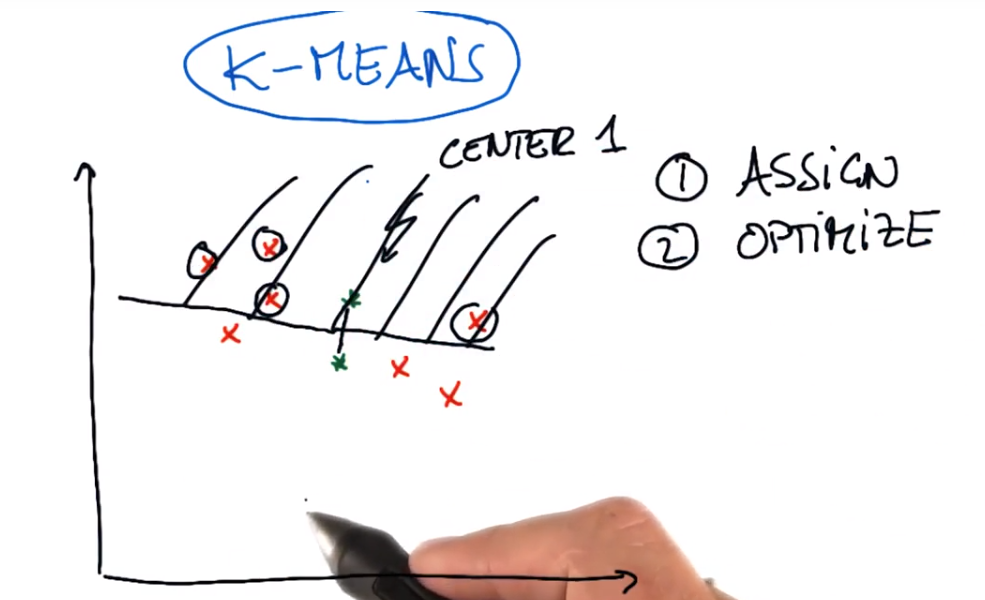
聚类:K-means
1.随意画出聚类中心
2.分配
3.优化
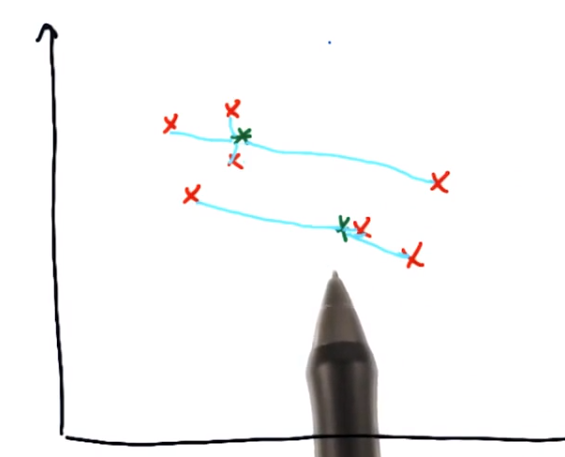
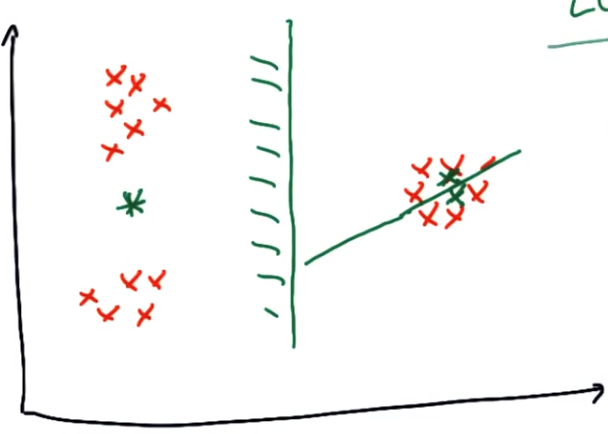
连接集群中心,画等距垂直于两集群连线的线
优化:移动中心
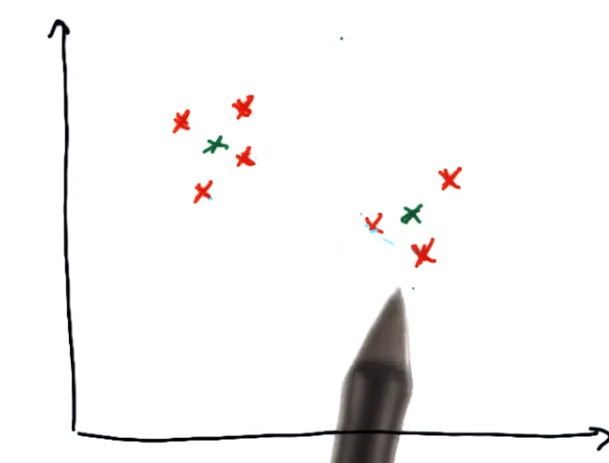
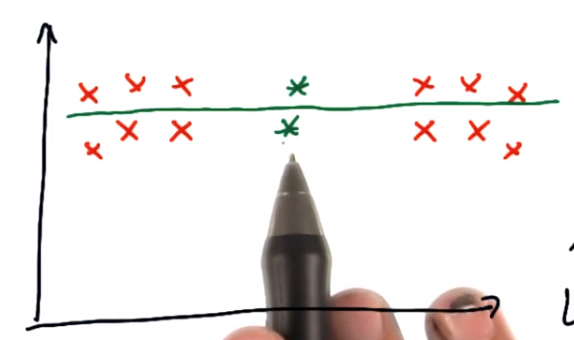
再分配,再优化········直至两个类的正确中心位置
很有意思的k-means可视化工具 http://www.naftaliharris.com/blog/visualizing-k-means-clustering/
聚类算法 http://scikit-learn.org/stable/modules/clustering.html
k-means http://scikit-learn.org/stable/modules/generated/sklearn.cluster.KMeans.html
使用k-means 一开始就要确定聚类数量,工作原理各点之间的距离
n_clusters 聚类数量,默认8
max_iter 最大迭代数
n_init 控制算法的初始化次数(????)
k-means局限性:对于一个固定的数据集,一个固定数量的簇中心,预测出的结果是不同的(初始聚类中心的位置决定)
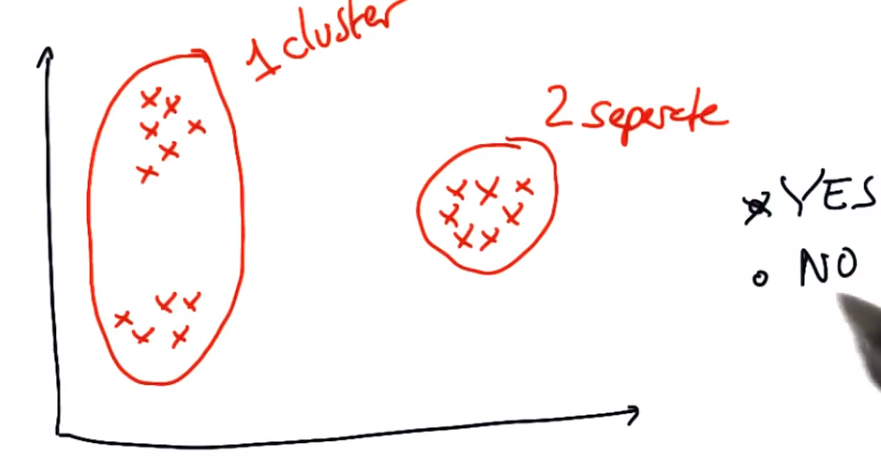
K-means的最初中心点选择对最后的分类效果有很大关系,比如下图出现的聚类,就有很大的问题
k-means均值聚类迷你项目
1. 可以在 k_means/k_means_cluster.py 中找到初始代码,该代码会读入电子邮件 + 财务 (E+F) 数据集,让我们为聚类做好准备。首先你将基于两个财务特征开始执行 K-means,请查看代码并确定代码使用哪些特征进行聚类。
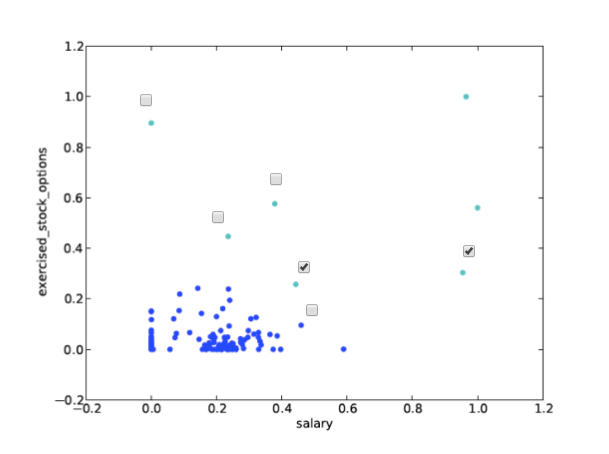
运行代码,这将创建数据的散点图
salary 、exercised_stock_options

2.在 financial_features 数据上部署 k-均值聚类,并将 2 个聚类指定为参数。将聚类预测存储到名为 pred 的列表,以便脚本底部的 Draw()命令正常工作
### cluster here; create predictions of the cluster labels
### for the data and store them to a list called pred

from sklearn.cluster import KMeans
kmeans = KMeans(n_clusters=2).fit(finance_features)
pred = kmeans.predict(finance_features)

3.向特征列表(features_list)中添加第三个特征:“total_payments”。现在使用 3 个,而不是 2 个输入特征重新运行聚类(很明显,我们仍然可以只显示原来的 2 个维度)。将聚类绘图与使用 2 个输入特征获取的绘图进行比较。是否有任何点切换群集?多少个点?这种使用 3 个牲的新聚类无法通过肉眼加以猜测——必须通过 k-均值算法才能识别它。
### the input features we want to use
### can be any key in the person-level dictionary (salary, director_fees, etc.)
feature_1 = "salary"
feature_2 = "exercised_stock_options"
feature_3 = "total_payments"
poi  = "poi"
features_list = [poi, feature_1, feature_2, feature_3]
data = featureFormat(data_dict, features_list )
poi, finance_features = targetFeatureSplit( data )


### in the "clustering with 3 features" part of the mini-project,
### you'll want to change this line to
### for f1, f2, _ in finance_features:
### (as it's currently written, the line below assumes 2 features)
for f1, f2, _ in finance_features:
    plt.scatter( f1, f2)
plt.show()

4.
本例中使用的“exercised_stock_options”特征取的最大值和最小值是什么?34348384、3285
本例中使用的“salary”特征取的最大值和最小值是什么?1111258、477
(注意:如果查看 finance_features,会发现有些“NaN”值已被清理并被零值取代——因此尽管那些值可能看起来像是最小值,但却具有欺骗性,因此它们更像是你不具有其相关信息而必须填入一个数字的点。对于此问题,请返回 data_dict 并查找显示的最大值和最小值,忽略所有“NaN”条目。)
stocklist = []
salarylist = []
for item in data_dict:
    stock = data_dict[item]['exercised_stock_options']
    salary = data_dict[item]['salary']
    if stock != 'NaN':
        stocklist.append(stock)
    if salary != 'NaN':
        salarylist.append(salary)

print 'max stock:',np.max(stocklist)
print 'min stock:',np.min(stocklist)
print 'max salary:',np.max(salarylist)
print 'min salary:',np.min(salarylist)
5.特征缩放之后的效果图以及和原图有变化的点