import numpy as np
import numpy.random as nr
import matplotlib.pyplot as pl
%matplotlib inline

# This notebook is based on an excellent tutorial by Kostis Gourgoulias (http://kgourgou.me/)

# Specify size of plot
pl.rcParams['figure.figsize'] = (12.0, 10.0)
会一会感知器算法
线性感知器算法可以根据预先选定的特征对数据点进行分类。我们的想法是找到一个直线(或超平面),分离不同特征的点。一旦我们得到直线,我们就可以根据点相对直线的位置(在上方或下方),来判断它是属于哪一个类别。
现在,让我们生成一个点集,然后根据一条线绘制它们。如果点在线的上面,它们是蓝色的,如果它们在下面,绿色。
# Generate some points
N = 100
xn = nr.rand(N,2)

x = np.linspace(0,1)

# Pick a line
#a, b = nr.rand(), nr.rand()
a, b = 0.8, 0.2
f = lambda x : a*x + b

fig = pl.figure()
figa = pl.gca()

pl.plot(xn[:,0],xn[:,1],'bo')
pl.plot(x,f(x),'r')

# Linearly separate the points by the line
yn = np.zeros([N,1])

for i in xrange(N):
    if(f(xn[i,0])>xn[i,1]):
        # Point is below line
        yn[i] = 1
        pl.plot(xn[i,0],xn[i,1],'go')
    else:
        # Point is above line
        yn[i] = -1


pl.legend(['Above','Separator','Below'],loc=0)
pl.title('Selected points with their separating line.')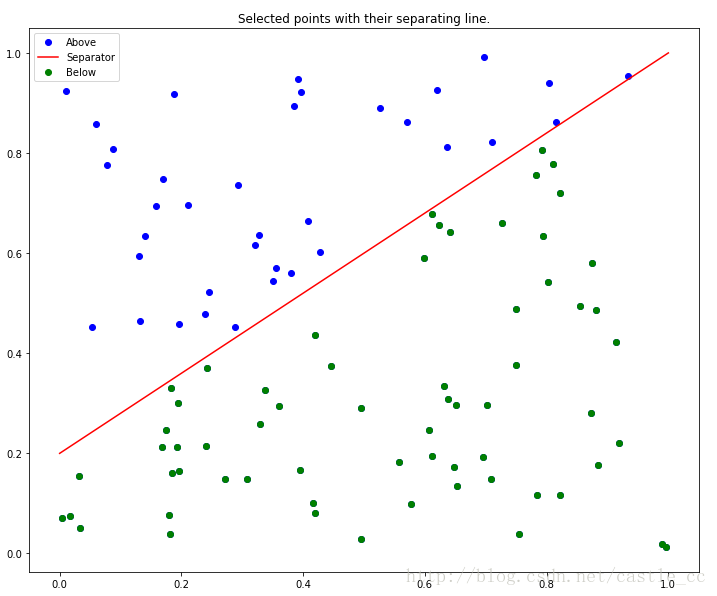
直线自然把空间分成两个区域,一个是绿色点区域,一个是蓝色点区域。因此,如果给我一个新的点,我可以根据曲线的位置给它分配一个颜色。真的很简单。
不那么简单的是找到给定点的直线。然而,如果给定点是线性可分离的,我可以移动一条直线直到我得到正确的位置。这就是感知器算法所做的。
def perceptron(xn, yn, max_iter=1000, w=np.zeros(3)):
    '''
        A very simple implementation of the perceptron algorithm for two dimensional data.

        Given points (x,y) with x in R^{2} and y in {-1,1}, the perceptron learning algorithm searches for the best
        line that separates the data points according to the difference classes defined in y.

        Input:
            xn : Data points, an Nx2 vector.
            yn : Classification of the previous data points, an Nx1 vector.
            max_iter : Maximum number of iterations (optional).
            w  : Initial vector of parameters (optional).

        Output:
            w : Parameters of the best line, y = ax+b, that linearly separates the data.

        Note:
            Convergence will be slower than expected, since this implementation picks points
            to update without a specific plan (randomly). This is enough for a demonstration, not
            so good for actual work.
'''

    N = xn.shape[0]

    # Separating curve
    f = lambda x: np.sign(w[0]+w[1]*x[0]+w[2]*x[1])

    for _ in xrange(max_iter):
        i = nr.randint(N) # try a random sample from the dataset
        print i, xn[i,0], xn[i,1], f(xn[i,:]), yn[i]
        if(yn[i] != f(xn[i,:])): # If not classified correctly, adjust the line to account for that point.
            w[0] = w[0] + yn[i] # the first weight is effectively the bias
            w[1] = w[1] + yn[i] * xn[i,0]
            w[2] = w[2] + yn[i] * xn[i,1]


    return w
我们已经写好了感知器算法,我们来看看它的效果
w = perceptron(xn, yn)

# Using weights w to compute a,b for a line y=a*x+b
bnew = -w[0]/w[2];
anew = -w[1]/w[2];
y = lambda x: anew * x + bnew;

# Computing the colors for the points
sep_color = (yn+1)/2.0;

pl.figure();
figa = pl.gca()

pl.scatter(xn[:,0],xn[:,1],c=sep_color, s=30)
pl.plot(x,y(x),'b--',label='Line from perceptron implementation.')
pl.plot(x,f(x),'r',label='Original line.')
pl.legend()

pl.title('Comparison between the linear separator and the perceptron approximation.')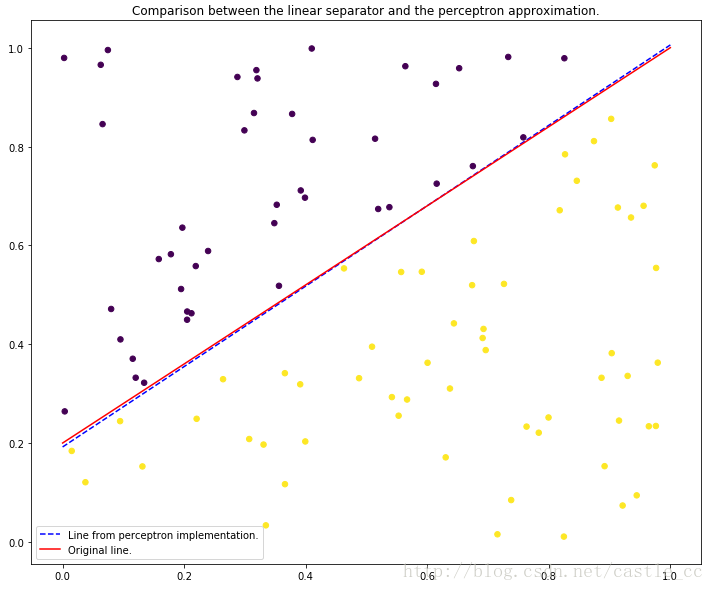
不错,对吧?该算法应该能够收敛到分离线的良好近似。如果没有,请再次运行最后一段代码。 因为该算法随机选择点进行优化,所以在某些情况下收敛的不会很好。
若数据线性可分而且迭代次数足够,则该算法一定可以得到正确划分数据的直线。
如果数据集不是线性可分的该怎么办?
如果数据不能用一条直线分开,那么在大多数情况下,这个过程将不能很好地工作。有些分数将被正确分类,有些则不会。
# Change this function to select points with respect to a different curve.
f = lambda x: x**2;

x = np.linspace(0,1);

# Generate some data points to play with.
N = 100
xn = nr.rand(N,2)

# Classify based on f(x)
yn = np.sign(f(xn[:,0])-xn[:,1])

colors = (yn+1)/2.0;

# Try percepton with that data.
w = perceptron(xn, yn, max_iter=1000)

# Re-scale the weights to construct a new representation
bnew = -w[0]/w[2];
anew = -w[1]/w[2];
y = lambda x: anew * x + bnew;

figa = pl.gca()
pl.scatter(xn[:,0],xn[:,1],c=colors,s=50);
pl.title('Classification based on f(x)')

pl.plot(x,f(x),'r',label='Separating curve.')
pl.plot(x,y(x),'b--',label = 'Curve from perceptron algorithm.')

pl.legend()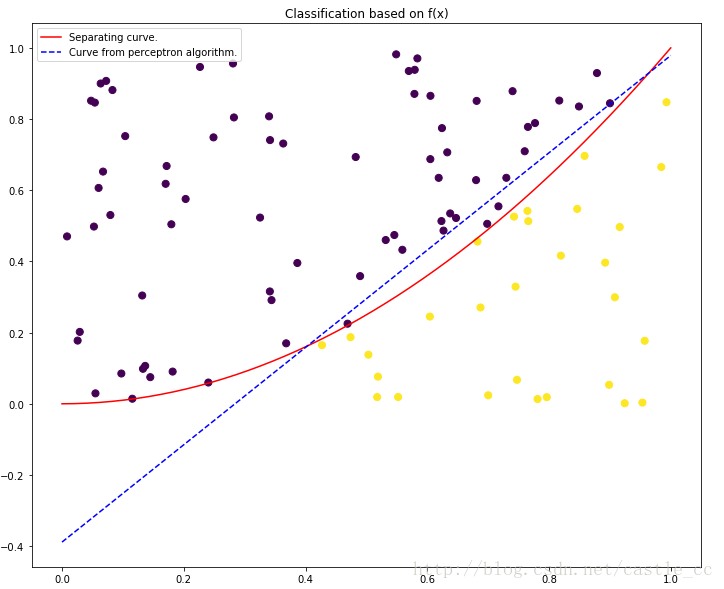
在这种情况下,我们的分类器不能正确地得到所有的情况(蓝点应该在蓝线上方,黄点在下面)。当我们增加更多的数据时,情况可能变得更糟。
感知器算法原理可参考:http://blog.csdn.net/castle_cc/article/details/78842170
本文内容基本来自:https://github.com/lexfridman/deepcars/blob/master/1_python_perceptron.ipynb