需求说明
1、在《ELK收集Apache的json格式访问日志并按状态码绘制图表》中,收集了Apache的json格式日志,在此实验基础上,增加nginx的json日志收集,并自定义filebeat的索引。本次实验也是基于《ELK收集Apache的json格式访问日志并按状态码绘制图表》;
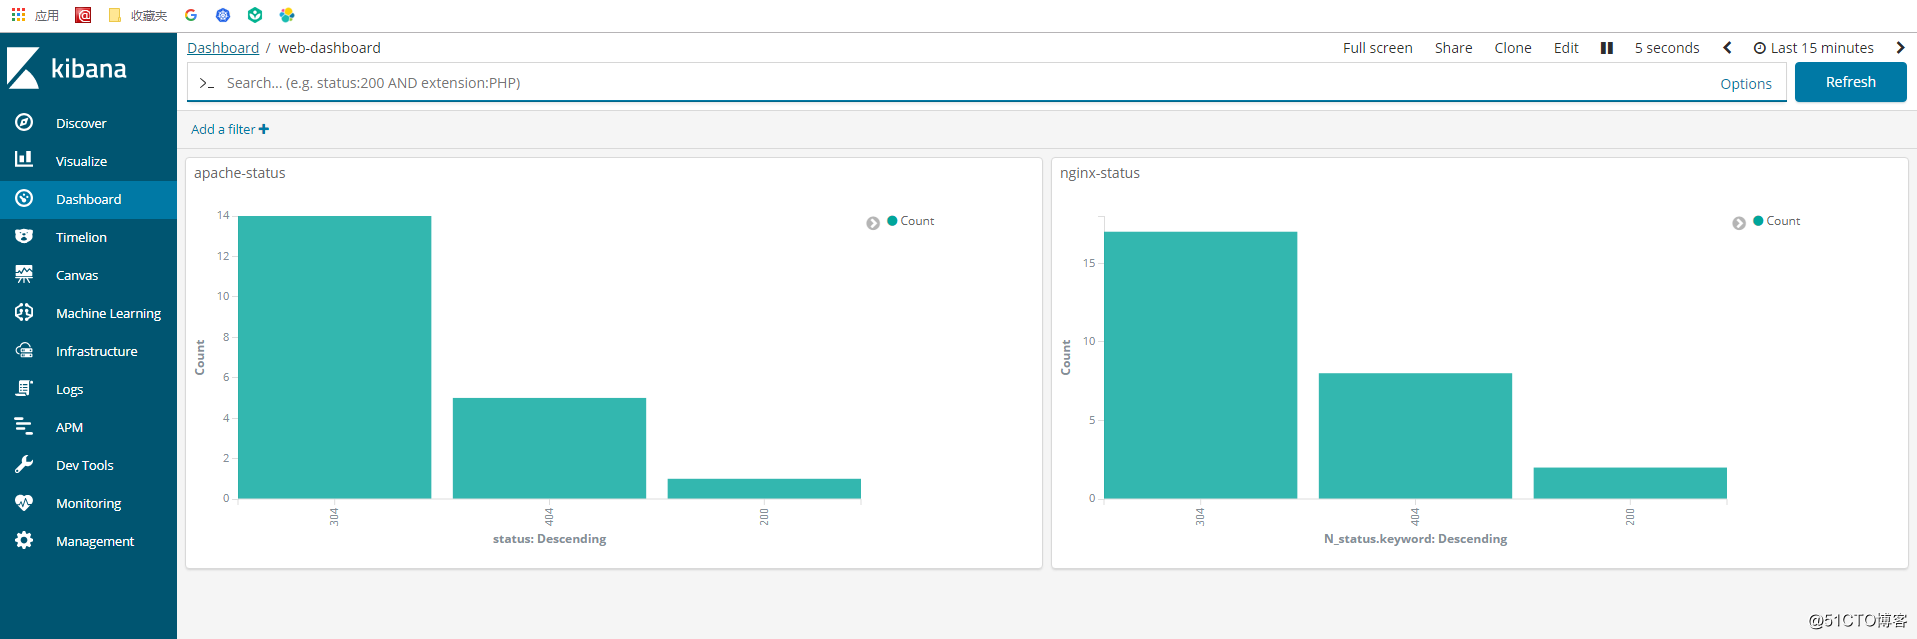
2、将nginx和Apache的日志按照状态码绘制柱状图,并将其添加到dashboard;
环境说明
10.0.0.101(test101)——部署apache、nginx、filebeat
10.0.0.102(test102)——部署elasticsearch、kibana
系统:centos7.3
备注:本次实验的重点在于怎样用filebeat收集多日志的json格式日志,并自定义索引,因此也没有装logstash。日志数据从filebeat——elasticsearch——kibana展示
操作步骤
1、在test101服务器部署nginx并配置日志格式
1.1 安装nginx
[root@test101 conf]#yum -y install nginx1.2 修改配置文件将端口改成8080(因为80端口已经被Apache占用)
[root@test101 conf]# vim /etc/nginx/conf.d/default.conf

server {
    listen       8080;      #将默认的80端口改成80
    server_name  localhost;

    #charset koi8-r;
    #access_log  /var/log/nginx/host.access.log  main;
        ......   #省略若干行
[root@test101 conf]#
1.3 编写index.html
在/usr/share/nginx/html/目录下编写了一个测试的index.html文件,以提供访问,生成日志: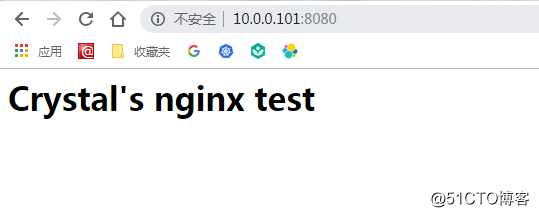
当前生成的日志格式为:
[root@test101 nginx]# tailf /var/log/nginx/access.log

10.0.0.1 - - [17/Dec/2018:11:25:11 +0800] "GET / HTTP/1.1" 304 0 "-" "Mozilla/5.0 (Windows NT 6.1; Win64; x64) AppleWebKit/537.36 (KHTML, like Gecko) Chrome/70.0.3538.77 Safari/537.36" "-"
10.0.0.1 - - [17/Dec/2018:11:25:11 +0800] "GET / HTTP/1.1" 304 0 "-" "Mozilla/5.0 (Windows NT 6.1; Win64; x64) AppleWebKit/537.36 (KHTML, like Gecko) Chrome/70.0.3538.77 Safari/537.36" "-"
10.0.0.1 - - [17/Dec/2018:11:25:11 +0800] "GET / HTTP/1.1" 304 0 "-" "Mozilla/5.0 (Windows NT 6.1; Win64; x64) AppleWebKit/537.36 (KHTML, like Gecko) Chrome/70.0.3538.77 Safari/537.36" "-"
1.4 修改nginx输出格式为json格式
修改/etc/nginx/nginx.conf,注释掉文件中log_format和access_log,添加新的日志输出格式:
[root@test101 nginx]# cat -n nginx.conf
     1
     2  user  nginx;
     3  worker_processes  1;
     4
     5  error_log  /var/log/nginx/error.log warn;
     6  pid        /var/run/nginx.pid;
     7
     8
     9  events {
    10      worker_connections  1024;
    11  }
    12
    13
    14  http {
    15      include       /etc/nginx/mime.types;
    16      default_type  application/octet-stream;

    17  #注释掉下面部分内容(18-21行):
    18      #log_format  main  '$remote_addr - $remote_user [$time_local] "$request" '
    19      #                 '$status $body_bytes_sent "$http_referer" '
    20      #                  '"$http_user_agent" "$http_x_forwarded_for"';
    21      #access_log  /var/log/nginx/access.log  main;

    22  #添加新的日志输出格式(23-33行)
    23      log_format main_json '{"@timestamp":"$time_local",'
    24      '"N_client_ip": "$remote_addr",'
    25      '"N_request": "$request",'
    26      '"N_request_time": "$request_time",'
    27      '"N_status": "$status",'
    28      '"N_bytes": "$body_bytes_sent",'
    29      '"N_user_agent": "$http_user_agent",'
    30      '"N_x_forwarded": "$http_x_forwarded_for",'
    31      '"N_referer": "$http_referer"'
    32      '}';
    33       access_log  /var/log/nginx/access.log main_json;
    34
    35
    36      sendfile        on;
    37      #tcp_nopush     on;
    38
    39      keepalive_timeout  65;
    40
    41      #gzip  on;
    42
    43      include /etc/nginx/conf.d/*.conf;
    44  }
[root@test101 nginx]#
}
1.5 重启nginx,检查日志输出格式
重启nginx后,再访问nginx首页http://10.0.0.101:8080 ,可以看到日志格式已经变成了json格式:
[root@test101 nginx]# tailf /var/log/nginx/access.log

{"@timestamp":"17/Dec/2018:11:33:01 +0800","N_client_ip": "10.0.0.1","N_request": "GET / HTTP/1.1","N_request_time": "0.000","N_status": "304","N_bytes": "0","N_user_agent": "Mozilla/5.0 (Windows NT 6.1; Win64; x64) AppleWebKit/537.36 (KHTML, like Gecko) Chrome/70.0.3538.77 Safari/537.36","N_x_forwarded": "-","N_referer": "-"}
{"@timestamp":"17/Dec/2018:11:33:02 +0800","N_client_ip": "10.0.0.1","N_request": "GET / HTTP/1.1","N_request_time": "0.000","N_status": "304","N_bytes": "0","N_user_agent": "Mozilla/5.0 (Windows NT 6.1; Win64; x64) AppleWebKit/537.36 (KHTML, like Gecko) Chrome/70.0.3538.77 Safari/537.36","N_x_forwarded": "-","N_referer": "-"}
{"@timestamp":"17/Dec/2018:11:33:03 +0800","N_client_ip": "10.0.0.1","N_request": "GET / HTTP/1.1","N_request_time": "0.000","N_status": "304","N_bytes": "0","N_user_agent": "Mozilla/5.0 (Windows NT 6.1; Win64; x64) AppleWebKit/537.36 (KHTML, like Gecko) Chrome/70.0.3538.77 Safari/537.36","N_x_forwarded": "-","N_referer": "-"}
2、配置test101服务器filebeat日志采集
2.1 修改test101的filebeat配置文件,同时收集Apache和nginx的json日志,同时自定义索引
filebeat.yml文件修改两个地方:
1)修改 Filebeat inputs部分,增加nginx的日志采集
#=========================== Filebeat inputs =============================

filebeat.inputs:

# Each - is an input. Most options can be set at the input level, so
# you can use different inputs for various configurations.
# Below are the input specific configurations.

- type: log
  enabled: true
  paths:
    - /var/log/httpd/access_log
  json.keys_under_root: true
  json.overwrite_keys: true

- type: log          #增加nginx的日志收集内容
  enabled: true
  paths:
    - /var/log/nginx/access.log
  json.keys_under_root: true
  json.overwrite_keys: true
2)修改Elasticsearch output 部分,增加索引配置
#-------------------------- Elasticsearch output ------------------------------
setup.template.name: "test101_web"     #增加索引
setup.template.pattern: "test101_web-"    #增加索引
output.elasticsearch:
  # Array of hosts to connect to.
  hosts: ["10.0.0.102:9200"]
  index: "test101_web-%{+yyyy.MM.dd}"    #增加索引
  # Optional protocol and basic auth credentials.
  #protocol: "https"
  #username: "elastic"
  #password: "changeme"
3)删除kibana界面创建的索引和test102服务器上elasticsearch的索引:

[root@test102 ~]# curl 10.0.0.102:9200/_cat/indices
green open .kibana_1 udOUvbprSnKWUJISwD0r_g 1 0 3 0 62.8kb 62.8kb
[root@test102 ~]#
4)重启test101的filebeat,生成新的索引:
[root@test102 filebeat]# curl 10.0.0.102:9200/_cat/indices
yellow open test101_web-2018.12.17 Rg31xncWSAm4oLER8DO5yg 5 1 45 0 589.4kb 589.4kb   #新的索引
green  open .kibana_1              udOUvbprSnKWUJISwD0r_g 1 0  6 0  34.5kb  34.5kb
[root@test102 filebeat]# 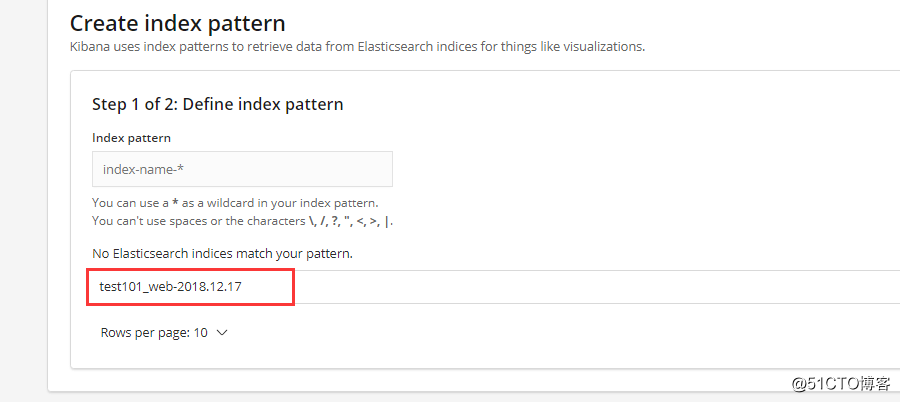
2.2 在kibana重建索引,检查Apache和nginx日志收集的正确性:
Apache json日志: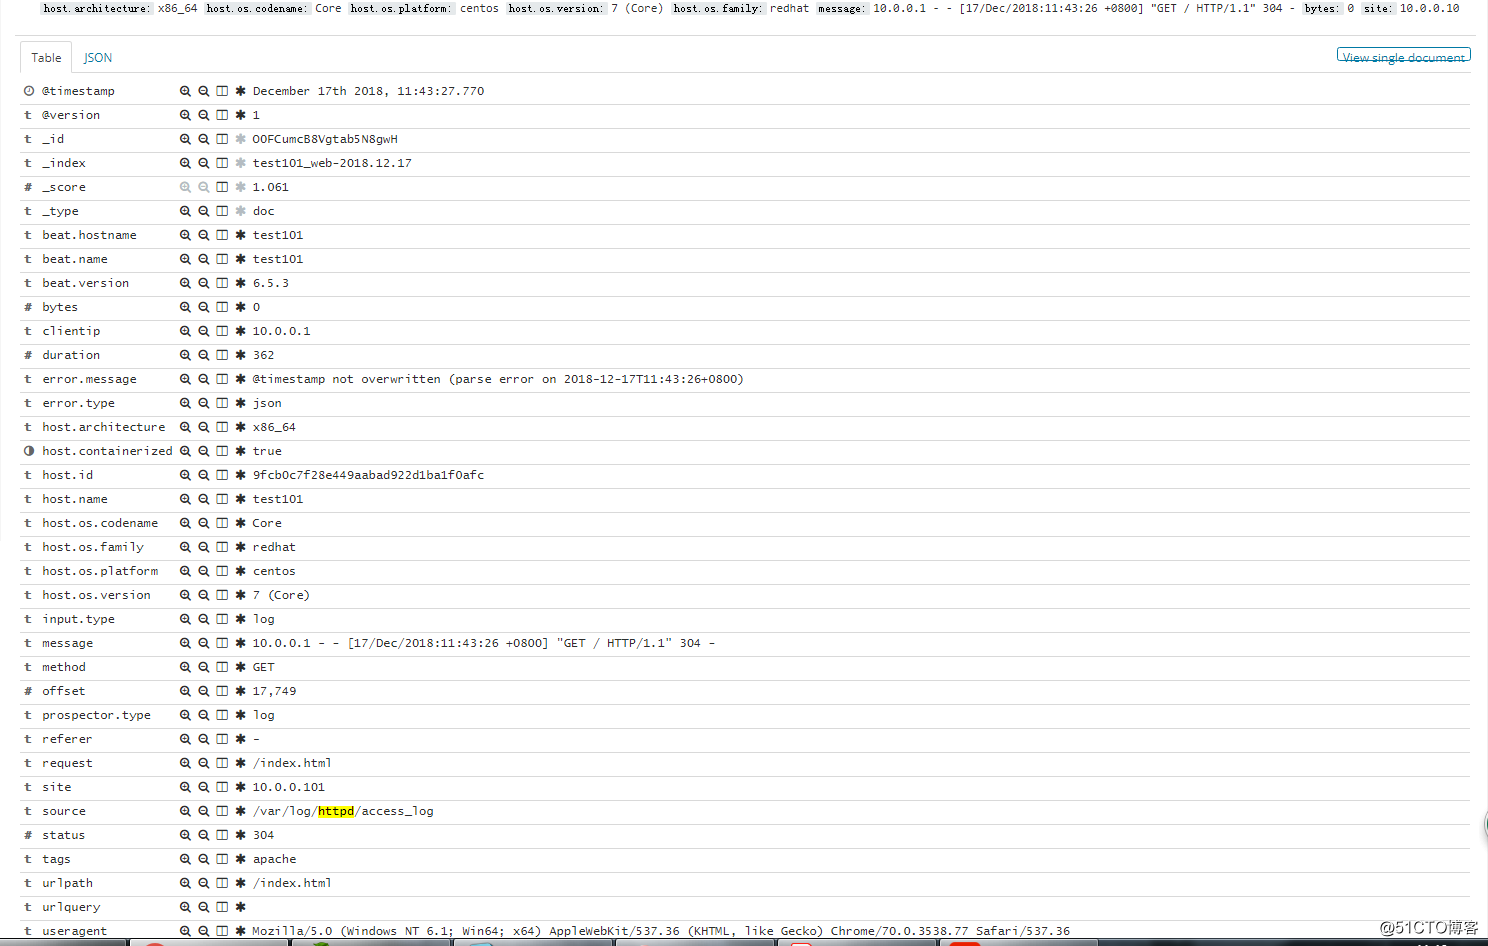
nginx json日志: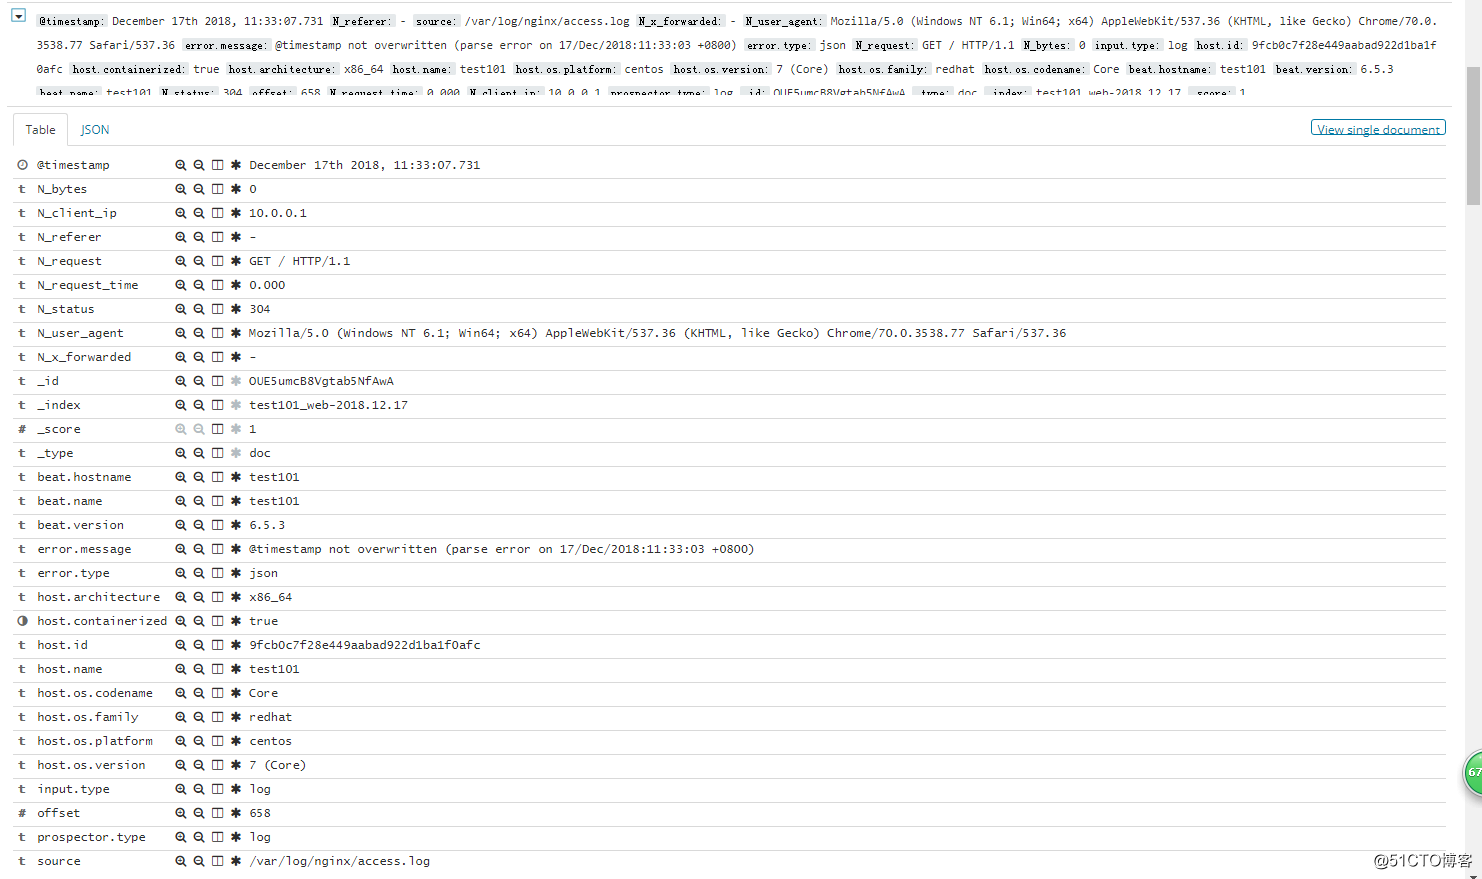
3、图表绘制
以nginx图形为例:
在Visualize界面选择Vertical Bar图形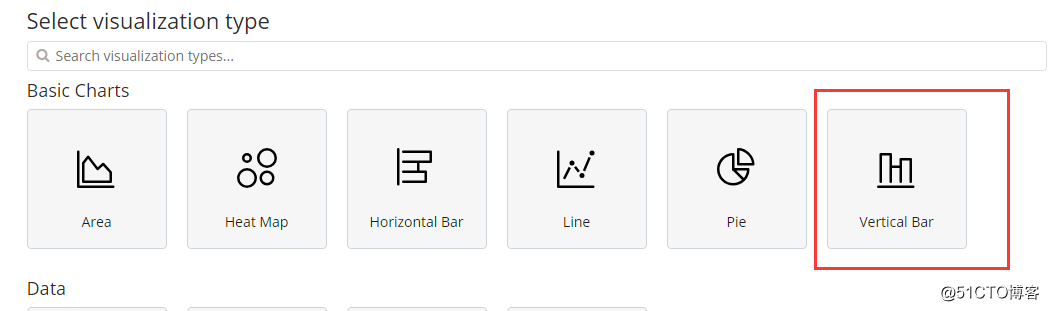
选择索引数据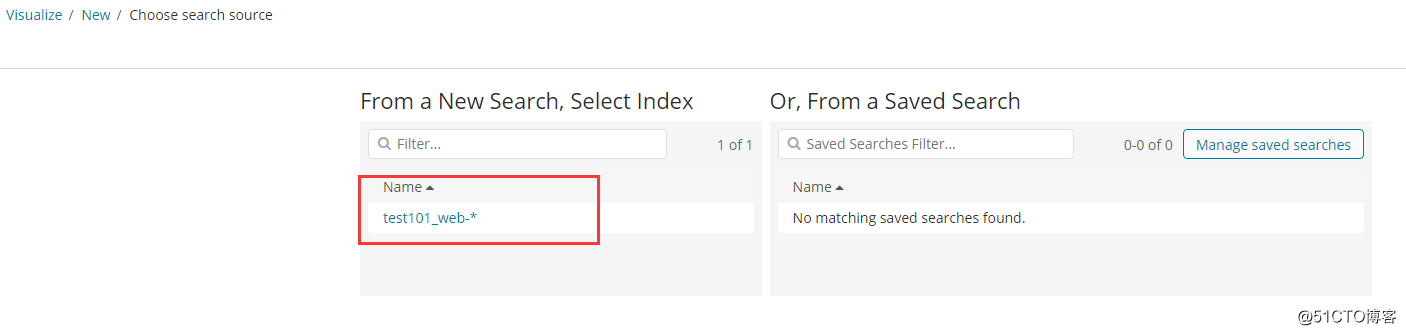
配置X轴数据,点击预览,得到右边的图形: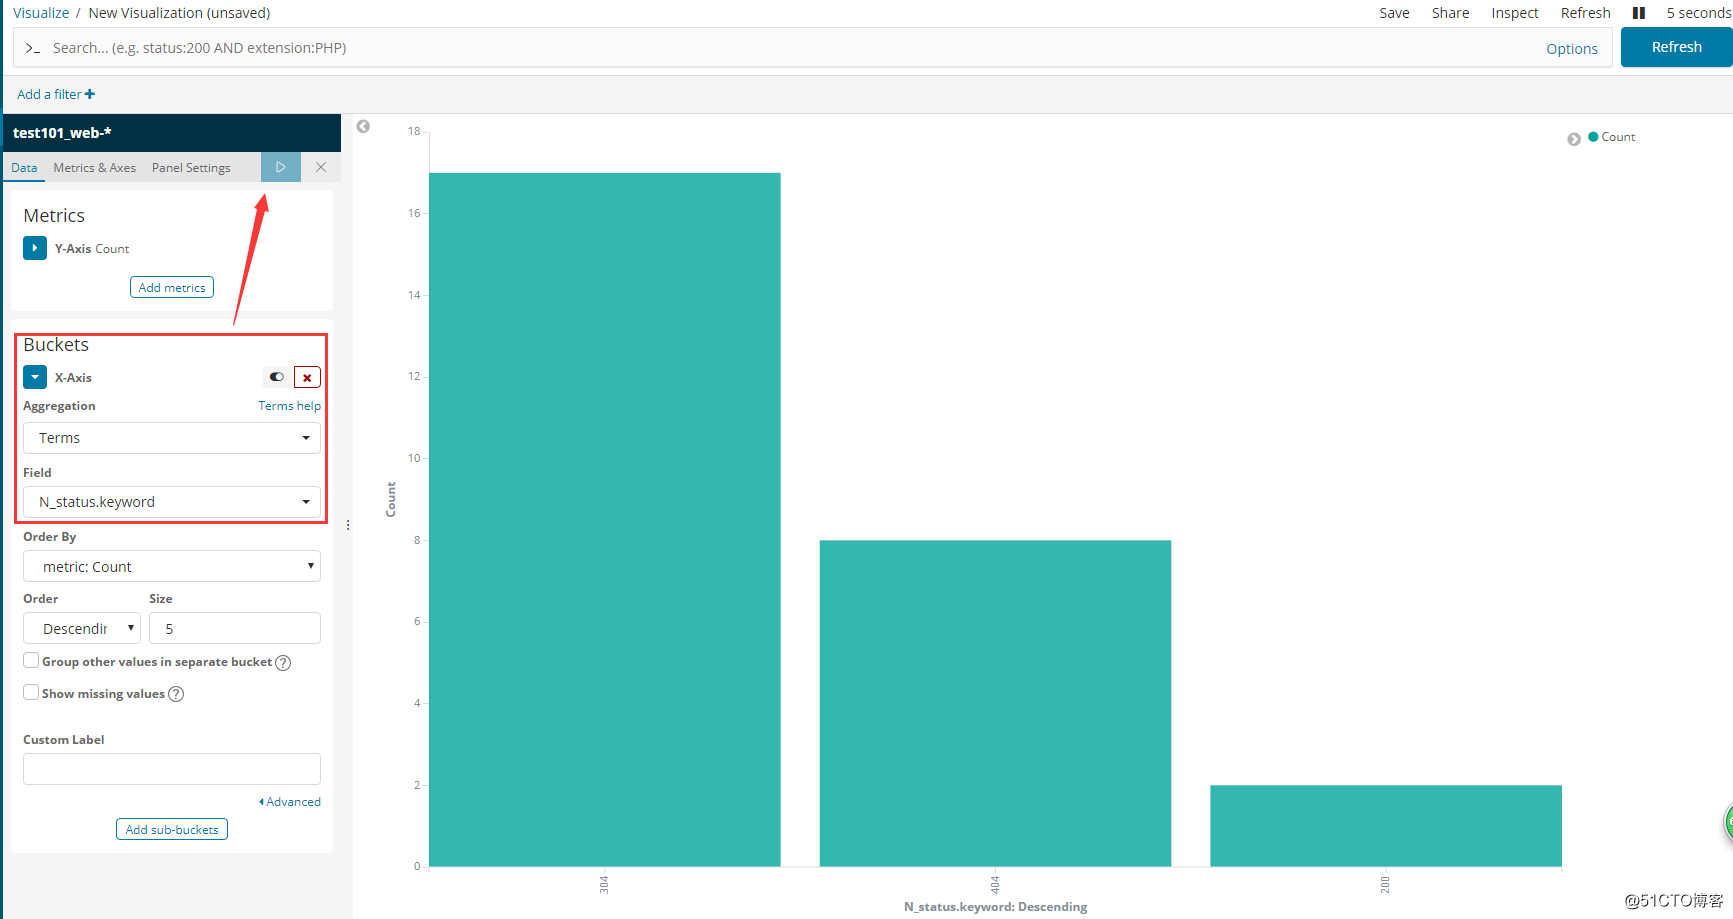
保存为nginx-status: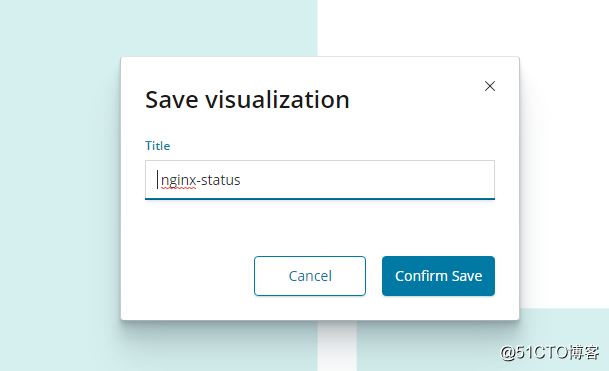
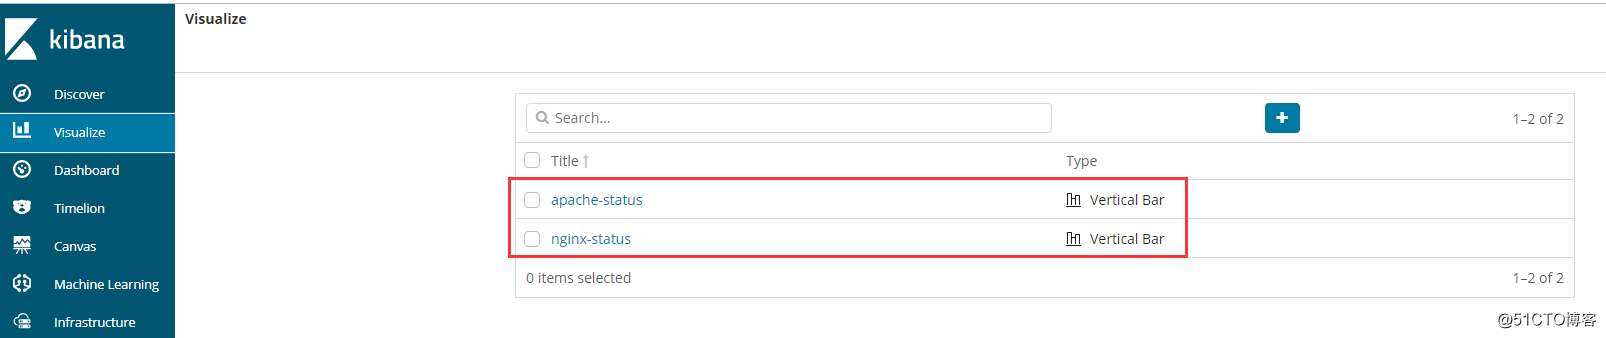
同样,绘制Apache状态码图形。
注意,根据《ELK收集Apache的json格式访问日志并按状态码绘制图表》的配置,绘制图形的时候,在Field那里不是选择N_status.keywaord,而是选择status。
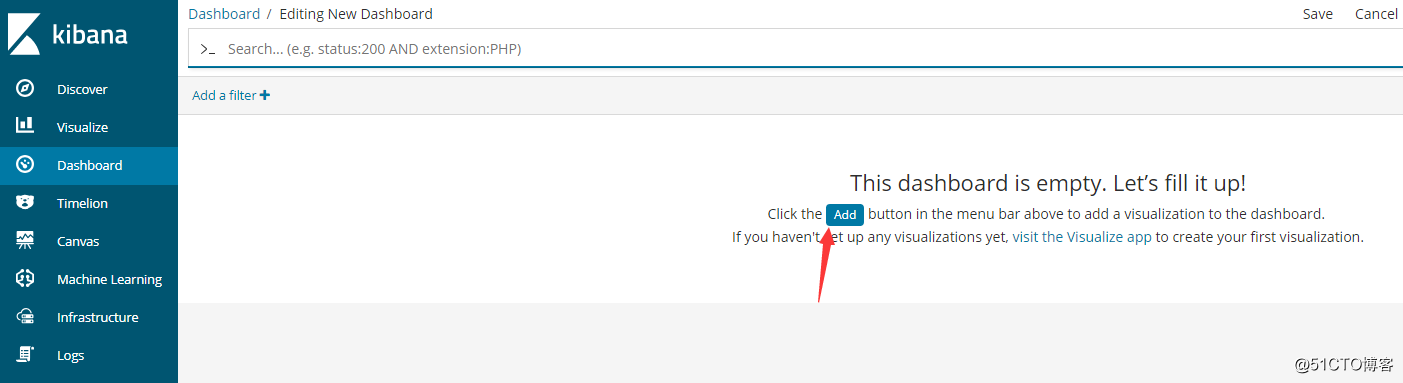
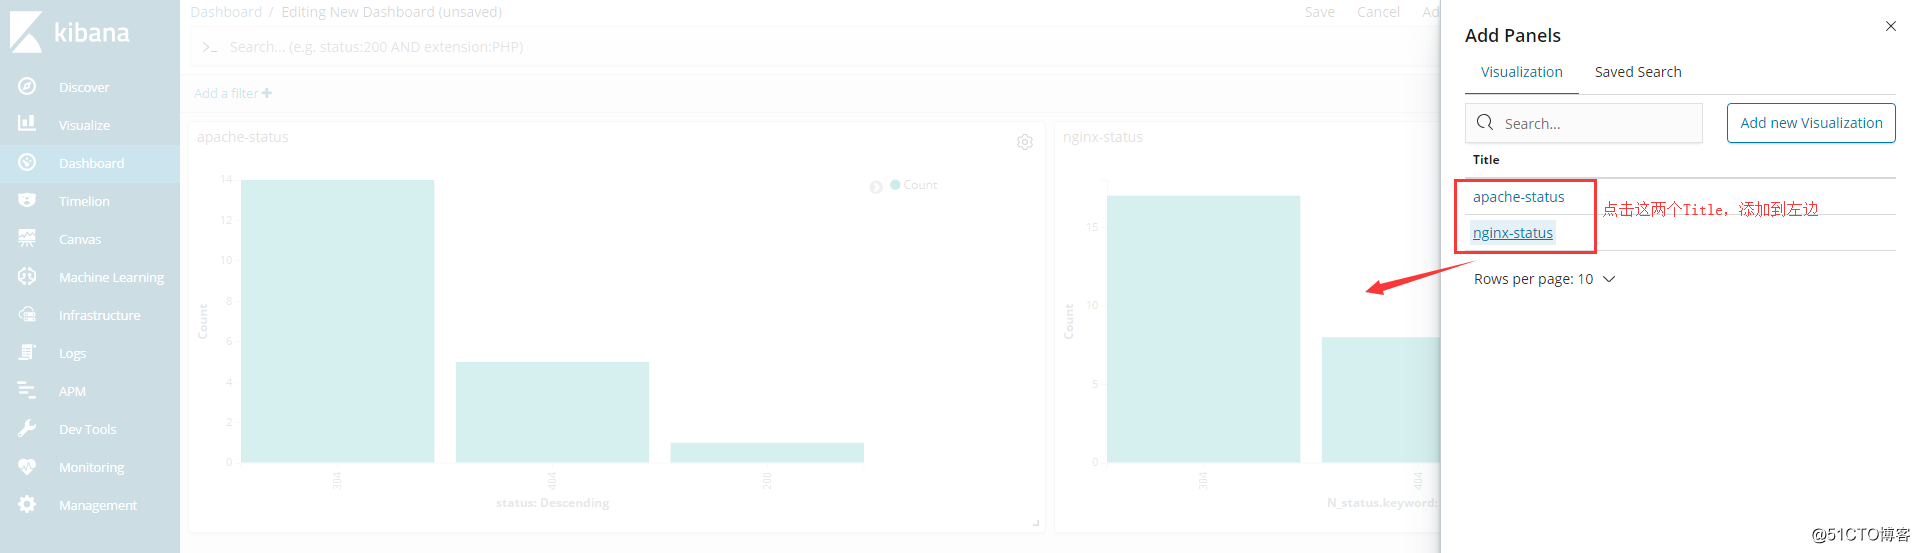
4、将图形添加到dashboard
绘制完成后,将apache-status和nginx-status两张图标添加到dashboard: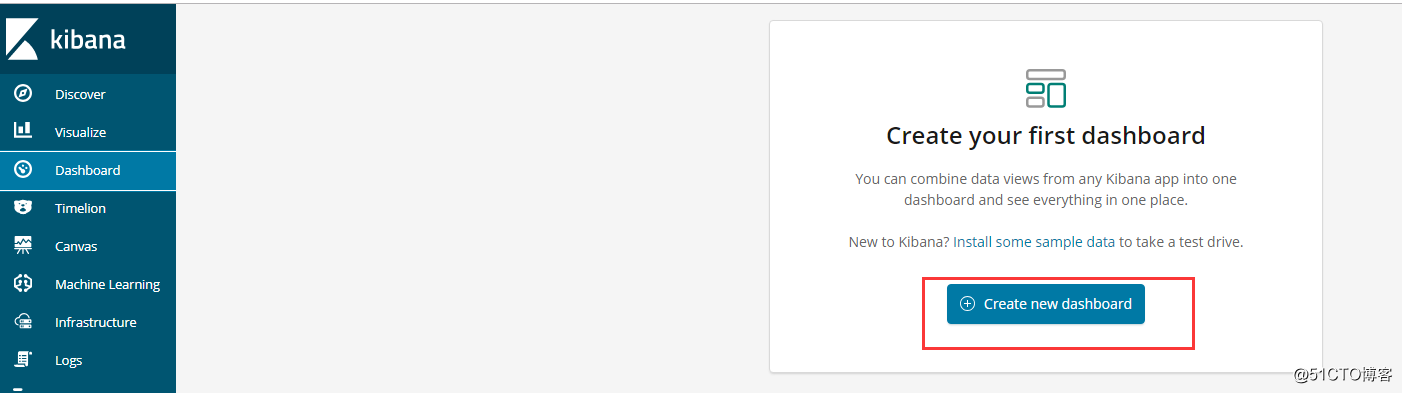
保存dashboard: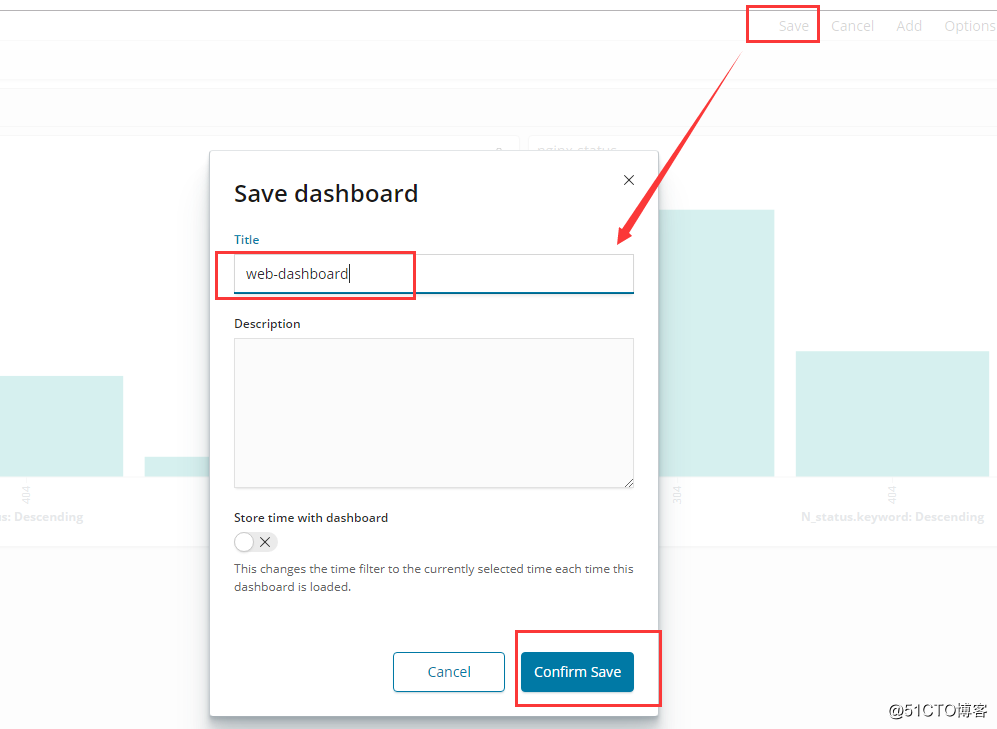
dashboard界面图标绘制完成,刷新界面,status状态码动态刷新: