版权声明:本文为博主原创文章,未经博主允许不得转载。 https://blog.csdn.net/qq_33168578/article/details/82715608
目的:对echarts图表进行封装调用--仪表盘篇。
基础的仪表盘有两种方式都可以实现,一是echarts图表,一是css3的方式也可以实现。主要讲解echarts的方式
法一:echarts方法
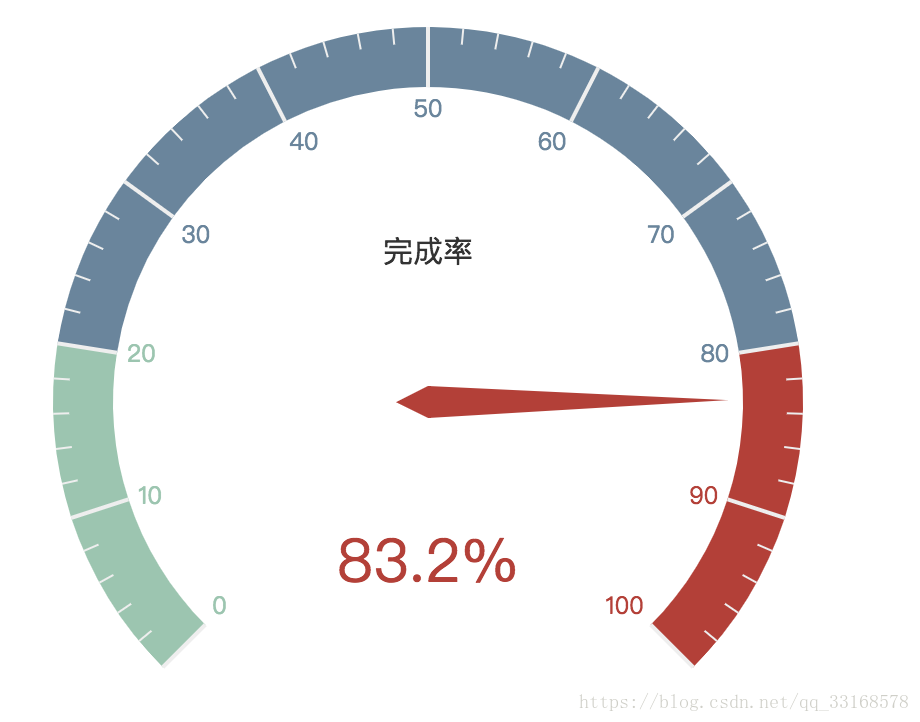
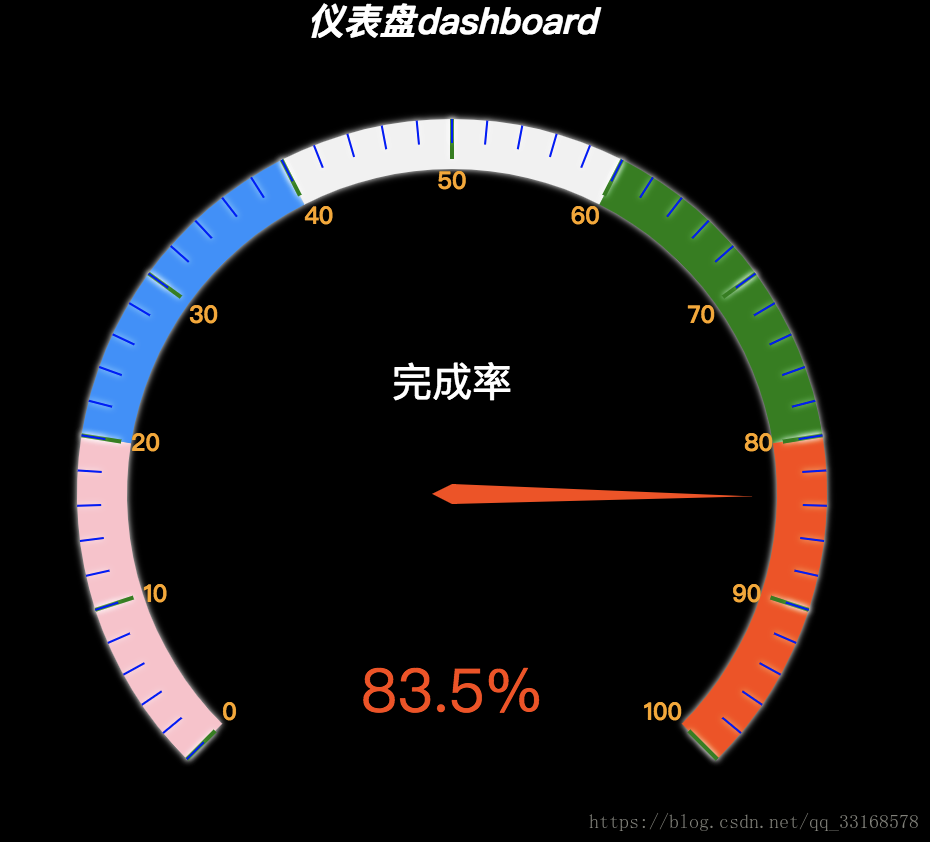
普通样式 修改图表配置之后的样式
1)页面中引入echarts、jquery文件
<script src="./js/jquery-1.9.0.js"></script>
<script src="./js/echarts.min.js"></script>echarts官网下载地址:http://echarts.baidu.com/download.html
2)封装代码,可以按照自己的设计图稍做修改,以下只是简单的配置(以下注释的部分是对指针,分割线,刻度线等的详细配置代码,有需要的可以根据自己的需求作出修改)
 var Dash = function (className, data) {
        var myChart2 = echarts.init($("." + className)[0]);
        var legendArr = [];
        for (var key in data) {
            legendArr.push(data[key].name);
        }
        option = {
            title: {
                text: '仪表盘dashboard', //标题文本内容
                x: 'center',
                y: 'top',
                textStyle: { // 标题样式
                    fontWeight: 'bolder',
                    fontStyle: 'italic',
                    color: '#fff',
                    shadowColor: '#fff', //默认透明
                    shadowBlur: 10
                }

            },

            tooltip: { //  提示框样式,鼠标悬浮交互时的信息提示
                formatter: "{a} <br/>{b} : {c}%"
            },

            series: [{
                name: '业务指标',
                type: 'gauge',
                // axisLine: { // 坐标轴线
                //     lineStyle: { // 属性lineStyle控制线条样式
                //         color: [ //仪表盘的轴线可以被分成不同颜色的多段。每段的  结束位置(范围是[0,1]) 和  颜色  可以通过一个数组来表示。默认取值:[[0.2, '#91c7ae'], [0.8, '#63869e'], [1, '#c23531']]
                //             [0.2, 'pink'],
                //             [0.4, '#1e90ff'],
                //             [0.6, '#f1f1f1'],
                //             [0.8, 'green'],
                //             [1, '#ff4500']
                //         ],
                //         width: 25, //轴线宽度,默认 30。
                //         shadowColor: '#fff', //默认透明
                //         shadowBlur: 10
                //     }
                // },
                // axisLabel: { // 坐标轴小标记
                //     textStyle: { // 属性lineStyle控制线条样式
                //         fontWeight: 'bolder',
                //         color: 'orange', //刻度数字颜色
                //         shadowColor: '#fff', //默认透明
                //         shadowBlur: 10
                //     }
                // },
                // axisTick: { // 刻度样式
                //     splitNumber: 5, // 分隔线之间分割的刻度数,默认 5。
                //     length: 12, // 属性length控制线长,刻度线长度
                //     lineStyle: { // 属性lineStyle控制线条样式
                //         color: 'blue', //刻度线颜色
                //         shadowColor: '#fff', //默认透明
                //         shadowBlur: 10
                //     }
                // },
                // splitLine: { // 分隔线样式
                //     length: 20, // 属性length控制线长,整数刻度线长度
                //     lineStyle: {
                //         width: 2, //整数刻度线长度
                //         color: 'green', //整点刻度线颜色
                //         shadowColor: '#fff', //默认透明
                //         shadowBlur: 10
                //     }
                // },
                // pointer: { //指针
                //     width: 5, //指针宽度
                //     shadowColor: '#fff', //默认透明
                //     shadowBlur: 5
                // },
                // title: {
                //     offsetCenter: [0, '-30%'], //相对于仪表盘中心的偏移位置,数组第一项是水平方向的偏移,第二项是垂直方向的偏移。可以是绝对的数值,也可以是相对于仪表盘半径的百分比。
                //     textStyle:{
                //         color: "#fff", // 文字的颜色,默认 #333。
                //         fontSize: 20, // 文字的字体大小,默认 15。
                //     }


                // },
                // detail: {
                //     //backgroundColor: 'rgba(30,144,255,0.8)',
                //     // borderWidth: 1,
                //     borderColor: '#fff',
                //     shadowColor: '#fff', //默认透明
                //     shadowBlur: 5,
                //     width: 80,
                //     height: 30,
                //     offsetCenter: [25, '20%'], // x, y,单位px
                //     textStyle: { // 其余属性默认使用全局文本样式,详见TEXTSTYLE
                //         fontWeight: 'bolder',
                //         color: '#fff'
                //     }
                // },
                detail: {    //仪表盘详情,用于显示数据
                    // offsetCenter: [0,"50%"],// 相对于仪表盘中心的偏移位置,数组第一项是水平方向的偏移,第二项是垂直方向的偏移。可以是绝对的数值,也可以是相对于仪表盘半径的百分比。
                    formatter: '{value}%'
                },
                data: data
            }]
        };

        myChart2.setOption(option, true);
    };
3)调用封装的饼图方法
var data = {
        value: '83.2',
        name: '完成率'
    }
    $(function () {
        Dash('chart', data)
    })
法二:图片+计时器(适合有设计图的方式)
扫描二维码关注公众号,回复:
4655566 查看本文章

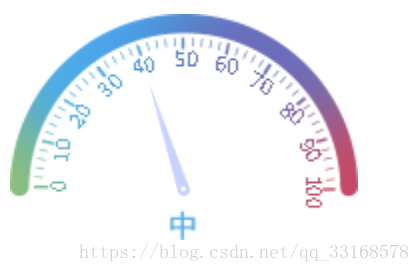
效果图片(根据需要增加内容,如果显示文字等信息,下载图表下面的p标签等位置)
1.页面中引入jquery文件
<script src="./js/jquery-1.9.0.js"></script>2).为指针和背景图片定位
html:<div class="dash"></div>
.dash {

            width: 174px;
            height: 113px;
            position: relative;
        }

        .dash-pin {
            position: absolute;
            left: 28px;
            top: 88px;
            width: 60px;
            height: 5.6px;
            background: url("./img/pin.png") no-repeat;
            background-size: 100%;
            transform-origin: 100% 50%;
        }
3)封装代码
 var createDash = function (name, url, value) {
        var $myDiv = $("." + name);
        var myAng = 180 * (value / 100);
        $myDiv.html("");
        var $myPin = $("<div class='dash-pin'></div>");
        var timer, angel = 0;
        $myDiv.append($myPin);
        $myDiv.css({
            "background": "url(" + url + ") no-repeat",
            "background-size": "100% 100%"
        });
        timer = setInterval(function () {
            if (angel <= myAng) {
                $myPin.css({
                    "transform": "rotate(" + angel + "deg)"
                });
                angel++;
            } else {
                clearInterval(timer);
                timer = null;
            }
        }, 60);
4)调用
createDash('dash', './img/dash3.png', 40)