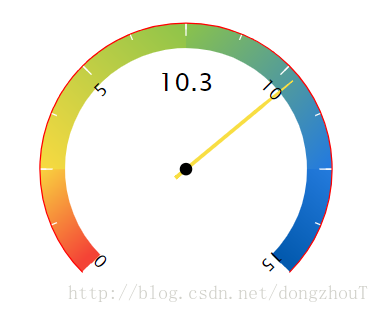
Highcharts 制作仪表盘 gauge

先看效果图
这里写图片描述

<!DOCTYPE html>
<html lang="en">
<head>
    <meta charset="UTF-8">
    <title>Title</title>
    <script src="http://ajax.googleapis.com/ajax/libs/jquery/1.8/jquery.min.js"></script>
    <script src="http://code.highcharts.com/highcharts.js"></script>
    <script src="http://code.highcharts.com/highcharts-more.js"></script>
    <script>
        $(function(){
            showEng('#container',10.3);
        });
        function showEng(domname,param1) {

            $(domname).highcharts({
                chart: {
                    type: 'gauge',
                    plotBackgroundColor: null,//绘图区背景颜色
                    plotBackgroundImage: null,
                    plotBorderWidth: null,//绘图区边框宽度
                    plotShadow: false,
                    shadow:false,
                    backgroundColor:'rgba(0,0,0,0)',//设置背景透明
                    marginLeft:25,//左右外边距
                    marginRight:25,
                    borderWidth:0//边框宽度
                },
                title: {
                    text: ''
                },
                pane: {
                    center: ['50%', '70%'],//xy偏移量
                    startAngle: -135,//开始角度
                    endAngle: 135,//结束角度
                    background: null,//面板背景
                },
                // the value axis
                yAxis: {
                    min: 0,//最小值
                    max: 15,//最大值
                    tickInterval:2.5,

                    minorTickInterval: 1.25,
                    minorTickWidth: 1,//次刻度线宽度
                    minorTickPosition: 'inside',//次刻度线位置
                    minorTickColor: '#ffffff',//次刻度线颜色
                    minorTickLength: 5,//次刻度线长度
                    tickPixelInterval: 30,//刻度线像素间隔
                    tickWidth: 1,
                    tickPosition: 'inside',
                    tickColor: '#ffffff',
                    lineWidth:1,//轴线宽度
                    lineColor:"#ff0000",//轴线颜色
                    offset:0,//Y轴偏移
                    labels: {
                        step: 2,
                        y:5,
//                        x:5,
                        rotation: 'auto',
                        style:{
                            "color": "#000",
                            "fontSize":"14px"
                        }
                    },
                    title: {
                        text: ''
                    },
                    //         plotBands: [
                    //             {
                    //                 from: 0,
                    //                 to: 15,
                    //                 thickness:20,
                    //                 color://设置渐变色
                    //
                    //                     {
                    //                         linearGradient: {//(x1, y1) 为起始点,(x2, y2) 结束点,其中 (0, 0) 点为图形的左上角,(1, 1) 为图形的右下角
                    //                             x1: 0,
                    //                             x2: 1,
                    //                             y1: 0.5,
                    //                             y2: 0.5
                    //                         },
                    //                         // radialGradient: { cx: 0.5, cy: 0.5, r: 0.5 },
                    //                         stops: [
                    //                             // [0, '#f44336'],
                    //                             [0, '#ff0000'],
                    //                             [0.4, '#f9da40'],
                    //                             [0.58, '#8bc34a'],
                    //                             [0.66, '#4D9C99'],
                    //                             [1, '#237CDA'] // darken
                    //                         ]
                    //                     }// green
                    //             }],
                    plotBands: [
                        {
                            from: 0,
                            to: 2.6,
                            thickness:20,
                            // color: '#f44336' ,//red
                            color://设置渐变色
                                {
                                    linearGradient: {
                                        x1: 0.5,
                                        x2: 0,
                                        y1: 1,
                                        y2: 0 //结束Y轴,基准是1,即100%高度
                                    },
                                    stops: [
                                        [0, '#f44336'],
                                        [1, '#f9da40'] // darken
                                    ]
                                }

                        }, {
                            from: 2.5,
                            to: 7.6,
                            thickness:20,
                            color://设置渐变色
                                {
                                    linearGradient: {
                                        x1: 0,
                                        x2: 1,
                                        y1: 1,
                                        y2: 0 //结束Y轴,基准是1,即100%高度
                                    },
                                    stops: [
                                        [0, '#f9da40'],
                                        [1, '#8bc34a'] // darken
                                    ]
                                }
                        }, {
                            from: 7.5,
                            to: 12.6,
                            thickness:20,
                            color://设置渐变色
                                {
                                    linearGradient: {
                                        x1: 0,
                                        x2: 1,
                                        y1: 0,
                                        y2: 0.9 //结束Y轴,基准是1,即100%高度
                                    },
                                    stops: [
                                        [0, '#8bc34a'],
                                        [1.5, '#247bdd'] // darken
                                    ]
                                }
                        }, {
                            from: 12.5,
                            to: 15,
                            thickness:20,
                            color://设置渐变色
                                {
                                    linearGradient: {
                                        x1: 1,
                                        x2: 0.5,
                                        y1: 0,
                                        y2: 1 //结束Y轴,基准是1,即100%高度
                                    },
                                    stops: [
                                        [0, '#247bdd'],
                                        [1, '#035AAF'] // darken
                                    ]
                                }// green
                        }]
                },
                credits: {
                    enabled: false//不显示版权信息
                },
                plotOptions: {
                    gauge: {
                        dataLabels: {
                            y: -90,
                            borderWidth: 0,
                            useHTML: true,
                            enabled: true
                        },
                        dial : {
                            backgroundColor: '#F8DE43',//指针背景色
                            radius : '95%',// 半径:指针长度
                            rearLength:'10%',//尾巴长度
                        },
                        borderWidth: 0
                    }

                },
                tooltip: {
                    enabled: false,
                    pointFormat: '{series.name}: <b>{point.y}个</b>'
                },
                series: [{
                    name: '能效',
                    data: [parseFloat(param1)],
                    tooltip: {
                        valueSuffix: ''
                    },
                    dataLabels: {
                        borderWidth: 0,
                        style: {
                            "fontSize": "20px",
                            'color': '#000',
                            "fontWeight": "normal"
                        }
                    }
                }]
            });
        }
    </script>


</head>
<body>
<div id="container" style="width: 600px; height: 300px; margin: 0 auto"></div>
</body>
</html>

  • 如果要去掉指针中间的黑色圆点,或者改变圆点颜色,例如:这里写图片描述

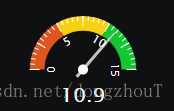
需要修改highcharts-more.js,源码,查找highcharts-pivot,将backgroundColor中的color改成需要的颜色:fill:g.backgroundColor||"rgba(0,0,0,0)"(设置透明色)。

  • 关于图表的颜色和渐变色,官方文档给出了很好的说明。

PS:官方api文档 做的非常好,点个赞

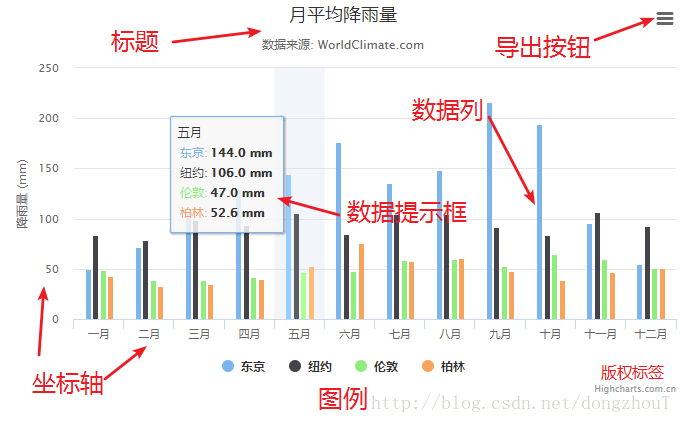
附一张Highcharts的图表组成图:
这里写图片描述

猜你喜欢

转载自blog.csdn.net/dongzhout/article/details/78051631