四、仪表盘 Gauge
<!DOCTYPE HTML>
<html>
    <head>
        <meta charset="utf-8"><link rel="icon" href="https://jscdn.com.cn/highcharts/images/favicon.ico">
        <meta name="viewport" content="width=device-width, initial-scale=1">
        <style>
            /* css 代码  */
        </style>
        <script src="https://code.highcharts.com.cn/highcharts/highcharts.js"></script>
        <script src="https://code.highcharts.com.cn/highcharts/highcharts-more.js"></script>
        <script src="https://code.highcharts.com.cn/highcharts/modules/exporting.js"></script>
        <script src="https://img.hcharts.cn/highcharts-plugins/highcharts-zh_CN.js"></script>
    </head>
    <body>
        <div id="container" style="min-width: 310px; max-width: 400px; height: 300px; margin: 0 auto"></div>
        <script>
            // JS 代码
        </script>
    </body>
</html>
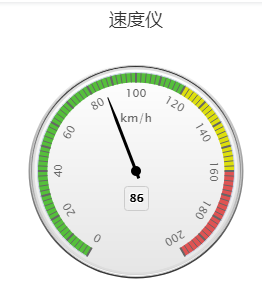
1、速度仪
var chart = Highcharts.chart('container',{
		chart: {
				type: 'gauge',
				plotBackgroundColor: null,
				plotBackgroundImage: null,
				plotBorderWidth: 0,
				plotShadow: false
		},
		title: {
				text: '速度仪'
		},
		pane: {
				startAngle: -150,
				endAngle: 150,
				background: [{
						backgroundColor: {
								linearGradient: { x1: 0, y1: 0, x2: 0, y2: 1 },
								stops: [
										[0, '#FFF'],
										[1, '#333']
								]
						},
						borderWidth: 0,
						outerRadius: '109%'
				}, {
						backgroundColor: {
								linearGradient: { x1: 0, y1: 0, x2: 0, y2: 1 },
								stops: [
										[0, '#333'],
										[1, '#FFF']
								]
						},
						borderWidth: 1,
						outerRadius: '107%'
				}, {
						// default background
				}, {
						backgroundColor: '#DDD',
						borderWidth: 0,
						outerRadius: '105%',
						innerRadius: '103%'
				}]
		},
		// the value axis
		yAxis: {
				min: 0,
				max: 200,
				minorTickInterval: 'auto',
				minorTickWidth: 1,
				minorTickLength: 10,
				minorTickPosition: 'inside',
				minorTickColor: '#666',
				tickPixelInterval: 30,
				tickWidth: 2,
				tickPosition: 'inside',
				tickLength: 10,
				tickColor: '#666',
				labels: {
						step: 2,
						rotation: 'auto'
				},
				title: {
						text: 'km/h'
				},
				plotBands: [{
						from: 0,
						to: 120,
						color: '#55BF3B' // green
				}, {
						from: 120,
						to: 160,
						color: '#DDDF0D' // yellow
				}, {
						from: 160,
						to: 200,
						color: '#DF5353' // red
				}]
		},
		series: [{
				name: 'Speed',
				data: [80],
				tooltip: {
						valueSuffix: ' km/h'
				}
		}]
}, function (chart) {
		if (!chart.renderer.forExport) {
				setInterval(function () {
						var point = chart.series[0].points[0],
								newVal,
								inc = Math.round((Math.random() - 0.5) * 20);
						newVal = point.y + inc;
						if (newVal < 0 || newVal > 200) {
								newVal = point.y - inc;
						}
						point.update(newVal);
				}, 3000);
		}
});
2、仪表盘

// 公共配置
Highcharts.setOptions({
    chart: {
        type: 'solidgauge'
    },
    title: null,
    pane: {
        center: ['50%', '85%'],
        size: '140%',
        startAngle: -90,
        endAngle: 90,
        background: {
            backgroundColor: (Highcharts.theme && Highcharts.theme.background2) || '#EEE',
            innerRadius: '60%',
            outerRadius: '100%',
            shape: 'arc'
        }
    },
    tooltip: {
        enabled: false
    },
    yAxis: {
        stops: [
            [0.1, '#55BF3B'], // green
            [0.5, '#DDDF0D'], // yellow
            [0.9, '#DF5353'] // red
        ],
        lineWidth: 0,
        minorTickInterval: null,
        tickPixelInterval: 400,
        tickWidth: 0,
        title: {
            y: -70
        },
        labels: {
            y: 16
        }
    },
    plotOptions: {
        solidgauge: {
            dataLabels: {
                y: 5,
                borderWidth: 0,
                useHTML: true
            }
        }
    }
});
// 速度仪表
var chart1 = Highcharts.chart('container-speed', {
    yAxis: {
        min: 0,
        max: 200,
        title: {
            text: '速度'
        }
    },
    credits: {
        enabled: false
    },
    series: [{
        name: '速度',
        data: [80],
        dataLabels: {
            format: '<div style="text-align:center"><span style="font-size:25px;color:' +
            ((Highcharts.theme && Highcharts.theme.contrastTextColor) || 'black') + '">{y}</span><br/>' +
            '<span style="font-size:12px;color:silver">km/h</span></div>'
        },
        tooltip: {
            valueSuffix: ' km/h'
        }
    }]
});
// 转速仪表
var chart2 = Highcharts.chart('container-rpm', {
    yAxis: {
        min: 0,
        max: 5,
        title: {
            text: 'RPM'
        }
    },
    series: [{
        name: 'RPM',
        data: [1],
        dataLabels: {
            format: '<div style="text-align:center"><span style="font-size:25px;color:' +
            ((Highcharts.theme && Highcharts.theme.contrastTextColor) || 'black') + '">{y:.1f}</span><br/>' +
            '<span style="font-size:12px;color:silver">* 1000 / min</span></div>'
        },
        tooltip: {
            valueSuffix: ' revolutions/min'
        }
    }]
});
// 定时刷新数据
setInterval(function () {
    var point,
        newVal,
        inc;
    if (chart1) {
        point = chart1.series[0].points[0];
        inc = Math.round((Math.random() - 0.5) * 100);
        newVal = point.y + inc;
        if (newVal < 0 || newVal > 200) {
            newVal = point.y - inc;
        }
        point.update(newVal);
    }
    if (chart2) {
        point = chart2.series[0].points[0];
        inc = Math.random() - 0.5;
        newVal = point.y + inc;
        if (newVal < 0 || newVal > 5) {
            newVal = point.y - inc;
        }
        point.update(newVal);
    }
}, 2000);
