这里使用 C++ 计算轨迹,生成 Python 文件,使用 matplotlib 绘图。
  1 // simulator.cpp : 此文件包含 "main" 函数。程序执行将在此处开始并结束。
  2 //
  3
  4 #include "pch.h" //预编译头,自行添加相关头文件
  5
  6 struct vec
  7 {
  8     double x;
  9     double y;
 10     double z;
 11 };
 12
 13 vec operator*(vec v, double n)
 14 {
 15     return { v.x * n , v.y * n , v.z * n};
 16 }
 17
 18 vec operator+(vec &x, vec &y)
 19 {
 20     return {x.x + y.x, x.y + y.y, x.z + y.z};
 21 }
 22
 23 //参数
 24 double a = 11;
 25 double b = 27;
 26 double c = 2;
 27
 28 vec velocity(vec &pos)
 29 {
 30     vec velocity;
 31     velocity.x = a * (pos.y - pos.x);
 32     velocity.y = pos.x * (b - pos.z) - pos.y;
 33     velocity.z = pos.x * pos.y - c * pos.z;
 34
 35     return velocity;
 36 }
 37
 38 //时间微元
 39 double dt = 0.001;
 40
 41 int main()
 42 {
 43     std::vector<vec> state;
 44
 45    //初始条件
 46     vec init_state = { 5.0, 5.0 , 5.0};
 47
 48     vec p = init_state;
 49
 50     int ii = 200000;
 51     for (int i = 0; i < ii; ++i)
 52     {
 53         vec v = velocity(p);
 54         vec dp = v * dt;
 55         p = p + dp;
 56         state.push_back(p);
 57         printf("\r[%2.1lf%%|%5d] p -> (%lf,%lf,%lf)", (double)i / ii * 100, i, p.x, p.y, p.z);
 58     }
 59
 60     printf("\n\nsaving...");
 61
 62     //输出python文件
 63
 64     std::ostringstream ox;
 65     std::ostringstream oy;
 66     std::ostringstream oz;
 67
 68     ox << "[";
 69     oy << "[";
 70     oz << "[";
 71
 72     for (size_t i = 0; i < state.size(); ++i)
 73     {
 74         ox << state[i].x;
 75         oy << state[i].y;
 76         oz << state[i].z;
 77
 78         ox << ",";
 79         oy << ",";
 80         oz << ",";
 81
 82         if ((i + 1) % 10 == 0)
 83         {
 84             ox << std::endl;
 85             oy << std::endl;
 86             oz << std::endl;
 87         }
 88     }
 89
 90     ox << "]";
 91     oy << "]";
 92     oz << "]";
 93
 94     std::ofstream f;
 95     f.open("output.py");
 96
 97     f << "import numpy as np" << std::endl;
 98     f << "import matplotlib.pyplot as plt" << std::endl;
 99     f << "from mpl_toolkits.mplot3d import Axes3D" << std::endl;
100
101     f << "x = " << ox.str();
102     f << std::endl;
103     f << "y = " << oy.str();
104     f << std::endl;
105     f << "z = " << oz.str();
106     f << std::endl;
107
108     f << "X = np.array(x)" << std::endl;
109     f << "Y = np.array(y)" << std::endl;
110     f << "Z = np.array(z)" << std::endl;
111
112     f << std::endl;
113
114     // f << "" << std::endl;
115     f << "fig = plt.figure()" << std::endl;
116     f << "ax = Axes3D(fig)" << std::endl;
117     f << "ax.plot(X, Y, Z)" << std::endl;
118     f << "plt.show()" << std::endl;
119     f << "" << std::endl;
120
121     f.close();
122 }
然后会输出 output.py
依赖的包有:numpy, matplotlib
然后直接执行 >python output.py即可
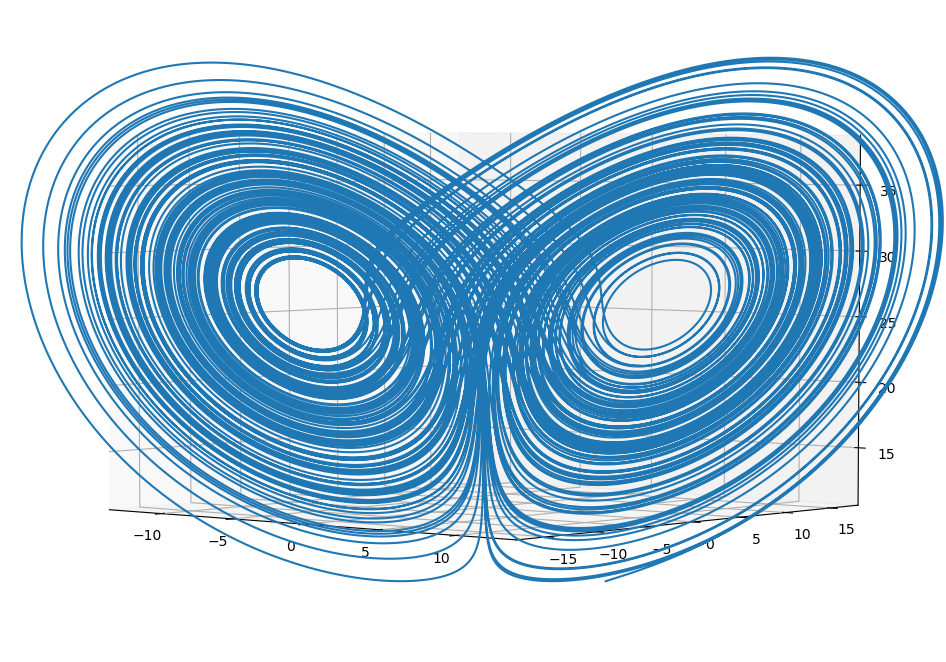
结果: