源链接为:http://cs231n.github.io/python-numpy-tutorial/。
这篇指导书是由Justin Johnson编写的。
在这门课程中我们将使用Python语言完成所有变成任务!Python本身就是一种很棒的通用编程语言,但是在一些流行的库帮助下(numpy,scipy,matplotlib)它已经成为科学计算的强大环境。
我们希望你们中的许多人都有一些Python和numpy的使用经验; 对你们其他人来说,这个section将作为Python用于科学计算和使用的快速速成课程。
你们中的一些人可能已经掌握了Matlab的知识,在这种情况下我们也推荐使用numpy。你也可以阅读由Volodymyr Kuleshov和Isaac Caswell(CS 228)编写的Notebook版笔记。
本教程使用的Python版本为Python3.
目录
原文共分为4部分,分别介绍了Python、Numpy、Scipy和Matplotlib的使用。本次翻译为最后两个部分:Scipy和Matplotlib的使用指导!
Scipy
Numpy提供了一个高性能的多维数组以及计算和操作这些数组的基本工具。Scipy(官方链接)以此为基础,提供大量在numpy数组上运行的函数,适用于不同类型的科学和工程应用。熟悉Scipy最好的方法就是浏览官方文档。我们将重点介绍一些对你可能有用的部分。
Image operations
Scipy提供了一些处理图像的基本函数。例如,它有将图像从磁盘读取到numpy数组,将numpy数组作为图像写入磁盘以及调整图像大小的功能。 这是一个展示这些功能的简单示例:
from scipy.misc import imread, imsave, imresize

# Read an JPEG image into a numpy array
img = imread('assets/cat.jpg')
print(img.dtype, img.shape)  # Prints "uint8 (400, 248, 3)"

# We can tint the image by scaling each of the color channels
# by a different scalar constant. The image has shape (400, 248, 3);
# we multiply it by the array [1, 0.95, 0.9] of shape (3,);
# numpy broadcasting means that this leaves the red channel unchanged,
# and multiplies the green and blue channels by 0.95 and 0.9
# respectively.
img_tinted = img * [1, 0.95, 0.9]

# Resize the tinted image to be 300 by 300 pixels.
img_tinted = imresize(img_tinted, (300, 300))

# Write the tinted image back to disk
imsave('assets/cat_tinted.jpg', img_tinted)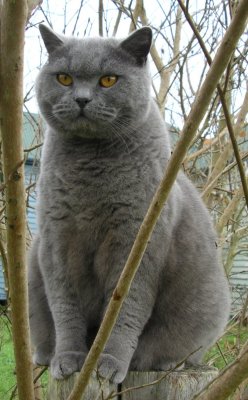

Left: The original image. Right: The tinted and resized image.
MATLAB files
scipy.io.loadmat和scipy.io.savemat函数允许你读取和写入MATLAB文件。你可以看这篇文档了解更多。
Distance between points
SciPy定义了一些用于计算各组点之间距离的有用函数。
函数scipy.spatial.distance.pdist计算给定集合中所有点对之间的距离:
import numpy as np
from scipy.spatial.distance import pdist, squareform

# Create the following array where each row is a point in 2D space:
# [[0 1]
#  [1 0]
#  [2 0]]
x = np.array([[0, 1], [1, 0], [2, 0]])
print(x)

# Compute the Euclidean distance between all rows of x.
# d[i, j] is the Euclidean distance between x[i, :] and x[j, :],
# and d is the following array:
# [[ 0.          1.41421356  2.23606798]
#  [ 1.41421356  0.          1.        ]
#  [ 2.23606798  1.          0.        ]]
d = squareform(pdist(x, 'euclidean'))
print(d)你可以在这篇文档里了解更多细节。另一个相似函数(scipy.spatial.distance.cdist)计算两组点之间所有对之间的距离; 你可以在文档中阅读它。
Matplotlib
Matplotlib是一个画图函数,这部分主要介绍matplotlib.pyplot模块,作用和MATLAB里的画图系统相似。
Plotting
在matplotlib里最重要的函数时plot,使用它可以绘制2D数据,这里有一个简单例子:
import numpy as np
import matplotlib.pyplot as plt

# Compute the x and y coordinates for points on a sine curve
x = np.arange(0, 3 * np.pi, 0.1)
y = np.sin(x)

# Plot the points using matplotlib
plt.plot(x, y)
plt.show()  # You must call plt.show() to make graphics appear.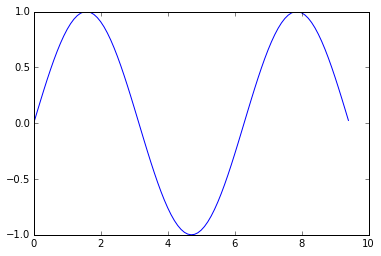
只需一点额外工作,我们就可以轻松地一次绘制多条线,并添加标题,图例和轴标签:
import numpy as np
import matplotlib.pyplot as plt

# Compute the x and y coordinates for points on sine and cosine curves
x = np.arange(0, 3 * np.pi, 0.1)
y_sin = np.sin(x)
y_cos = np.cos(x)

# Plot the points using matplotlib
plt.plot(x, y_sin)
plt.plot(x, y_cos)
plt.xlabel('x axis label')
plt.ylabel('y axis label')
plt.title('Sine and Cosine')
plt.legend(['Sine', 'Cosine'])
plt.show()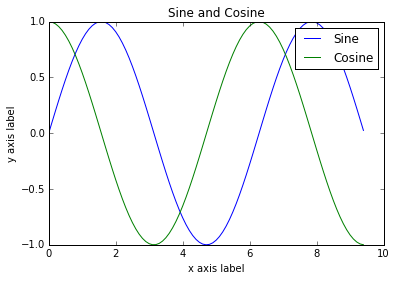
你可以在这篇文档里了解更多关于plot的信息。
Subplots
您可以使用子图功能在同一图中绘制不同的东西。 这是一个例子:
import numpy as np
import matplotlib.pyplot as plt

# Compute the x and y coordinates for points on sine and cosine curves
x = np.arange(0, 3 * np.pi, 0.1)
y_sin = np.sin(x)
y_cos = np.cos(x)

# Set up a subplot grid that has height 2 and width 1,
# and set the first such subplot as active.
plt.subplot(2, 1, 1)

# Make the first plot
plt.plot(x, y_sin)
plt.title('Sine')

# Set the second subplot as active, and make the second plot.
plt.subplot(2, 1, 2)
plt.plot(x, y_cos)
plt.title('Cosine')

# Show the figure.
plt.show()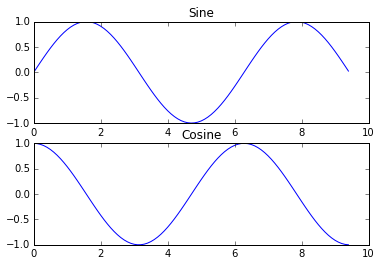
你可以在这篇文档里了解更多关于subplot的信息。
Images
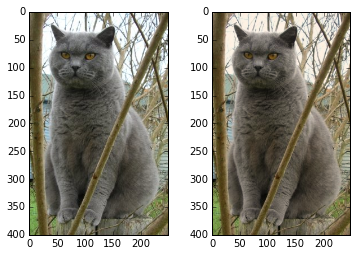
你可以使用imshow函数来显示图片,这里有一个例子:
import numpy as np
from scipy.misc import imread, imresize
import matplotlib.pyplot as plt

img = imread('assets/cat.jpg')
img_tinted = img * [1, 0.95, 0.9]

# Show the original image
plt.subplot(1, 2, 1)
plt.imshow(img)

# Show the tinted image
plt.subplot(1, 2, 2)

# A slight gotcha with imshow is that it might give strange results
# if presented with data that is not uint8. To work around this, we
# explicitly cast the image to uint8 before displaying it.
plt.imshow(np.uint8(img_tinted))
plt.show()