1.SIFT特征原理描述
SIFT是尺度不变特征变换,其过程包括兴趣点的采集和描述子。SIFT的描述子具有很强的稳健性,这也是SIFT特征成功和流行的主要原因。
SIFT具体可以分为以下几个步骤。
1.使用高斯差分函数来定位兴趣点:

Gσ是二维高斯核,Iσ是Gσ模糊的灰度图像,K是决定相差尺度的常数。兴趣点是在图像位置和尺度变化下D(x,σ)的最大值和最小值点。
SIFT描述子在兴趣点附近选取子区域网格,在每个区域内计算图像梯度方向直方图,每个子区域的直方图拼接起来组成描述子向量。SIFT描述子的标准设置使用4x4的子区域,每个子区域使用8个小区间的方向直方图,共计产生128个小区间直方图。最终确定特征方向。
2.SIFT特征和Harris特征匹配处理结果对比(两张图片)
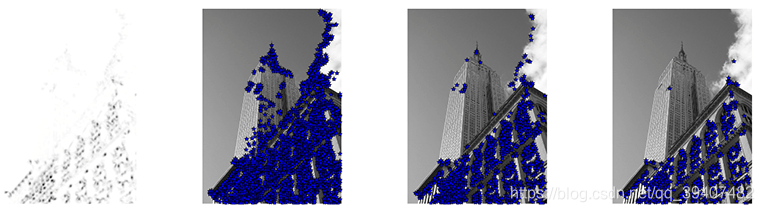
2.1二者检测感兴趣点的不同
#- coding: utf-8 --
from PIL import Image
from pylab import *
from PCV.localdescriptors import sift
from PCV.localdescriptors import harris

from matplotlib.font_manager import FontProperties
font = FontProperties(fname=r"c:\windows\fonts\SimSun.ttc", size=14)

imname = ‘21.jpg’
im = array(Image.open(imname).convert(‘L’))
sift.process_image(imname, ‘21.sift’)
l1, d1 = sift.read_features_from_file(‘21.sift’)
figure()
gray()
subplot(131)
sift.plot_features(im, l1, circle=False)
title(u’SIFT特征’,fontproperties=font)
subplot(132)
sift.plot_features(im, l1, circle=True)
title(u’用圆圈表示SIFT特征尺度’,fontproperties=font)

#检测harris角点
harrisim = harris.compute_harris_response(im)

subplot(133)
filtered_coords = harris.get_harris_points(harrisim, 6, 0.1)
imshow(im)
plot([p[1] for p in filtered_coords], [p[0] for p in filtered_coords], ‘*’)
axis(‘off’)
title(u’Harris角点’,fontproperties=font)

show()
2.2Harris特征匹配处理
#- coding: utf-8 --
from pylab import *
from PIL import Image

from PCV.localdescriptors import harris
from PCV.tools.imtools import imresize

“”"
This is the Harris point matching example in Figure 2-2.
“”"
im1 = array(Image.open(“21.jpg”).convert(“L”))
im2 = array(Image.open(“22.jpg”).convert(“L”))

resize加快匹配速度
im1 = imresize(im1, (int(im1.shape[1]/2), int(im1.shape[0]/2)))
im2 = imresize(im2, (int(im2.shape[1]/2), int(im2.shape[0]/2)))

wid = 5
harrisim = harris.compute_harris_response(im1, 5)
filtered_coords1 = harris.get_harris_points(harrisim, wid+1)
d1 = harris.get_descriptors(im1, filtered_coords1, wid)

harrisim = harris.compute_harris_response(im2, 5)
filtered_coords2 = harris.get_harris_points(harrisim, wid+1)
d2 = harris.get_descriptors(im2, filtered_coords2, wid)

print (‘starting matching’)
matches = harris.match_twosided(d1, d2)

figure()
gray()
harris.plot_matches(im1, im2, filtered_coords1, filtered_coords2, matches)
show()
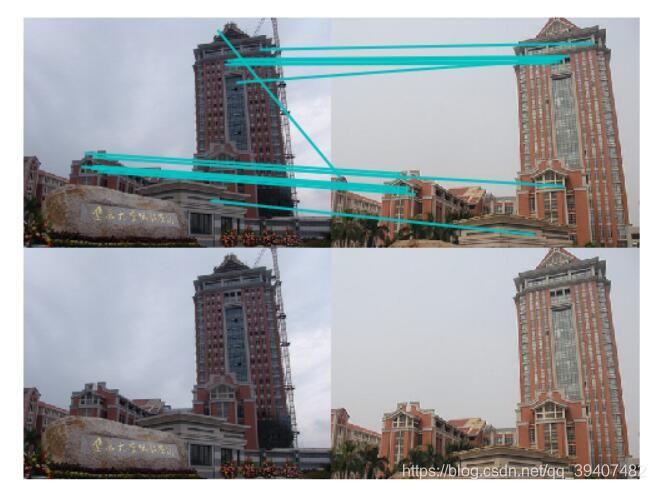
2.3SIFT特征匹配处理
在使用sift算法进行实验前,我们首先要准备一个VLFeat工具包,利用其提供的二进制文件进行计算特征。
下面是使用sift算法获取特征点并进行特征匹配的代码。
from PIL import Image
from pylab import *
import sys
from PCV.localdescriptors import sift

if len(sys.argv) >= 3:
im1f, im2f = sys.argv[1], sys.argv[2]
else:
im1f = ‘21.jpg’
im2f = ‘22.jpg’
im1 = array(Image.open(im1f))
im2 = array(Image.open(im2f))

sift.process_image(im1f, ‘out_sift_1.txt’)
l1, d1 = sift.read_features_from_file(‘out_sift_1.txt’)
figure()
gray()
subplot(121)
sift.plot_features(im1, l1, circle=False)

sift.process_image(im2f, ‘out_sift_2.txt’)
l2, d2 = sift.read_features_from_file(‘out_sift_2.txt’)
subplot(122)
sift.plot_features(im2, l2, circle=False)

matches = sift.match_twosided(d1, d2)
print (’{} matches’.format(len(matches.nonzero()[0])))

figure()
gray()
sift.plot_matches(im1, im2, l1, l2, matches, show_below=True)
show()
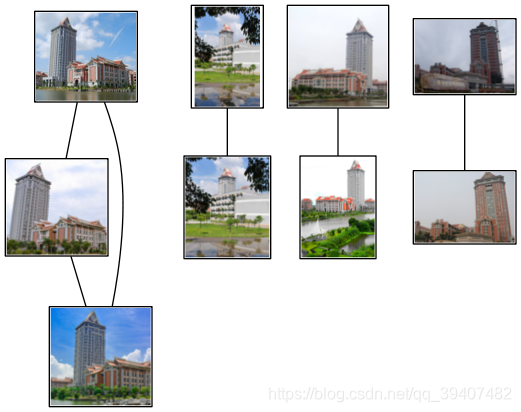
3 地理标记图像匹配
实验的素材是厦门市集美大学内的一座标志性建筑“尚大楼”范围。通过不同角度拍摄了9张照片,以此进行地理标记图像匹配。
在进行实验前要先安装完GraphViz,否则会出现错误。
-- coding: utf-8 --
from pylab import *
from PIL import Image
from PCV.localdescriptors import sift
from PCV.tools import imtools
import pydot

download_path = “D:\JetBrains\PyCharm2018.1\work1\sans” # set this to the path where you downloaded the panoramio images
path = “D:\JetBrains\PyCharm2018.1\work1” # path to save thumbnails (pydot needs the full system path)

list of downloaded filenames
imlist = imtools.get_imlist(download_path)
nbr_images = len(imlist)

extract features
featlist = [imname[:-3] + ‘sift’ for imname in imlist]
for i, imname in enumerate(imlist):
sift.process_image(imname, featlist[i])

matchscores = zeros((nbr_images, nbr_images))

for i in range(nbr_images):
for j in range(i, nbr_images): # only compute upper triangle
print ('comparing ', imlist[i], imlist[j])
l1, d1 = sift.read_features_from_file(featlist[i])
l2, d2 = sift.read_features_from_file(featlist[j])
matches = sift.match_twosided(d1, d2)
nbr_matches = sum(matches > 0)
print ('number of matches = ', nbr_matches)
matchscores[i, j] = nbr_matches
print (“The match scores is: \n”, matchscores)

copy values
for i in range(nbr_images):
for j in range(i + 1, nbr_images): # no need to copy diagonal
matchscores[j, i] = matchscores[i, j]

#可视化

threshold = 2 # min number of matches needed to create link

g = pydot.Dot(graph_type=‘graph’) # don’t want the default directed graph

for i in range(nbr_images):
for j in range(i + 1, nbr_images):
if matchscores[i, j] > threshold:
# first image in pair
im = Image.open(imlist[i])
im.thumbnail((100, 100))
filename = path + str(i) + ‘.png’
im.save(filename) # need temporary files of the right size
g.add_node(pydot.Node(str(i), fontcolor=‘transparent’, shape=‘rectangle’, image=filename))