HighCharts
npm install highcharts --save
<template>
  <div class="x-bar">
    <div :id="id" :option="option"></div>
  </div>
</template>
<script>
import HighCharts from "highcharts";
export default {
  name: "commonHighChart",
  props: {
    option: {                                   //对应的数据,必传
      type: Object,
      required : true,
    }
  },
  data(){
    let id ="commonHighChart" + parseInt(Math.random() * (1000000 + 1));    //生成随机id
    return {
      id:id,
    }
  },
  watch: {
    option(){                                   //监听到数据发生变化,重新渲染
      HighCharts.chart(this.id, this.option);
    }
  },
  mounted() {
    HighCharts.chart(this.id, this.option);
  },
};
</script>
import commonChart from "../components/commonChart.vue";

Vue.component('commonChart',commonChart);
<template>
<div class="home">
<div class="chart">
<commonChart class="high" :option="option"></commonChart>
</div>
</div>
</template>
<script>
export default {
name: "Home",
data() {
return {
option: {
chart: {
//图表类型
type: "line", //默认line图
width: 450, //图表宽度
zoomType: 'x' //图表缩放 x y xy
},
title: { //大标题
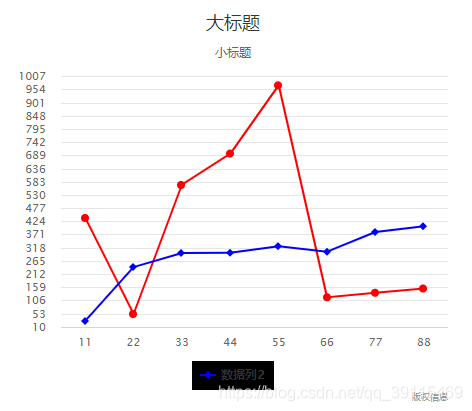
text: "大标题",
},
subtitle: { //小标题
text: "小标题",
},
yAxis: { //y轴
title: { //y轴标题
text: "",
},
categories: ['10', '1000']
},
xAxis: { //X轴
categories: [ //类别(x轴标签枚举)
"11",
"22",
"33",
"44",
"55",
"66",
"77",
"88",
],
},
series: [ //数据列
{
name: "数据列1",
data: [439, 52, 571, 696, 970, 119, 137, 154],
color : 'red', //呈现的线条颜色
showInLegend: false // 设置为 false 即为不显示在图例中
},
{
name: "数据列2",
data: [24, 240, 297, 298, 324, 302, 381, 404],
color : 'blue', //呈现的线条颜色
},
],
tooltip: { //数据提示框
backgroundColor: "#FCFFC5", //背景色
borderColor: "black", //边框颜色
borderRadius: 10, // 边框圆角
borderWidth: 3, // 边框宽度
crosshairs: [ //十字准线
{
width: 1,
color: "green",
},
{
width: 2,
color: "green",
},
],
shared: true //多个数据列共享提示
},
legend: { //图例
enabled: true,
backgroundColor : 'black',
verticalAlign: "bottom", //图例位置 top middle bottom
},
plotOptions: { //图例点击事件(非饼图pie)
series: {
events: {
legendItemClick: function() {
alert(1);
return false; //禁用点击事件
}
}
}
},
credits: { //版权信息
enabled: true,
text : '版权信息',
href: 'http://www.hcharts.cn'
},
},
};
}
};
</script>
<style scoped>
.home .chart{
width : 500px;
padding: 25px;
}
</style>
Echarts
npm install echarts --save
- 封装一个Echarts组件commonChart.vue
<template>
  <div class="x-bar">
    <div :id="id" :option="option" style="width: 100%; height: 100%"></div>
  </div>
</template>
<script>
import Echarts from "echarts";    //导入echarts
export default {
  name : 'commonEChart',
  props: {
    option: {                                   //对应的数据,必传
      type: Object,
      required : true,
    },
  },
  data(){
    let id ="commonEChart" + parseInt(Math.random() * (1000000 + 1));    //生成随机id
    return {
      id:id,
    }
  },
  watch: {
    option(){                                  //监听到数据发生变化,重新渲染
      let myChart = Echarts.init(document.getElementById(this.id));
      myChart.setOption(this.option);
    },
  },
  mounted() {                                  //初始化
    let myChart = Echarts.init(document.getElementById(this.id));
    myChart.setOption(this.option);
  },
};
</script>
- main.js中注册全局组件commonChart
import commonChart from './components/commonChart'

Vue.component('commonChart',commonChart);
<template>
<div class="about">
<commonChart
id="myEcharts"
class="myEcharts"
:option="Options"
/>
</div>
</template>
<script>
export default {
name: "Echarts",
data() {
return {
Options: {},
};
},
mounted() {
this.drawLine();
},
methods: {
drawLine() {
this.Options = {
color: ["#3398DB"],
tooltip: {
trigger: "axis",
axisPointer: {
type: "shadow",
},
},
grid: {
left: "3%",
right: "4%",
bottom: "3%",
containLabel: true,
},
xAxis: [
{
type: "category",
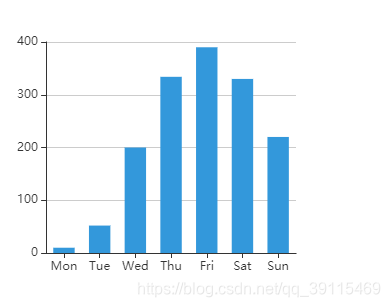
data: ["Mon", "Tue", "Wed", "Thu", "Fri", "Sat", "Sun"],
axisTick: {
alignWithLabel: true,
},
},
],
yAxis: [
{
type: "value",
},
],
series: [
{
name: "直接访问",
type: "bar",
barWidth: "60%",
data: [10, 52, 200, 334, 390, 330, 220],
},
],
};
},
},
};
</script>
<style scoped>
.myEcharts {
width: 400px;
height: 400px;
}
</style>