Kaggle课程 — 数据可视化 Data Visualization
)
本文翻译自kaggle官方网站https://www.kaggle.com/learn/data-visualization,仅供参考。
1. Hello,Seaborn
1.1 欢迎来到数据可视化!
在这个实际动手的微课程上,你将学习如何把你的数据可视化上升到下一个级别seaborn,一个有力的易于使用的数据可视化工具。为了使用seaborn,你将学习一点python编码。也就是说:
-
这门微课程面向那些没有编程经验的
-
每一张图表使用简短的代码,seaborn更加快速和易于使用,比起许多其他的数据可视化工具(例如Excel等)
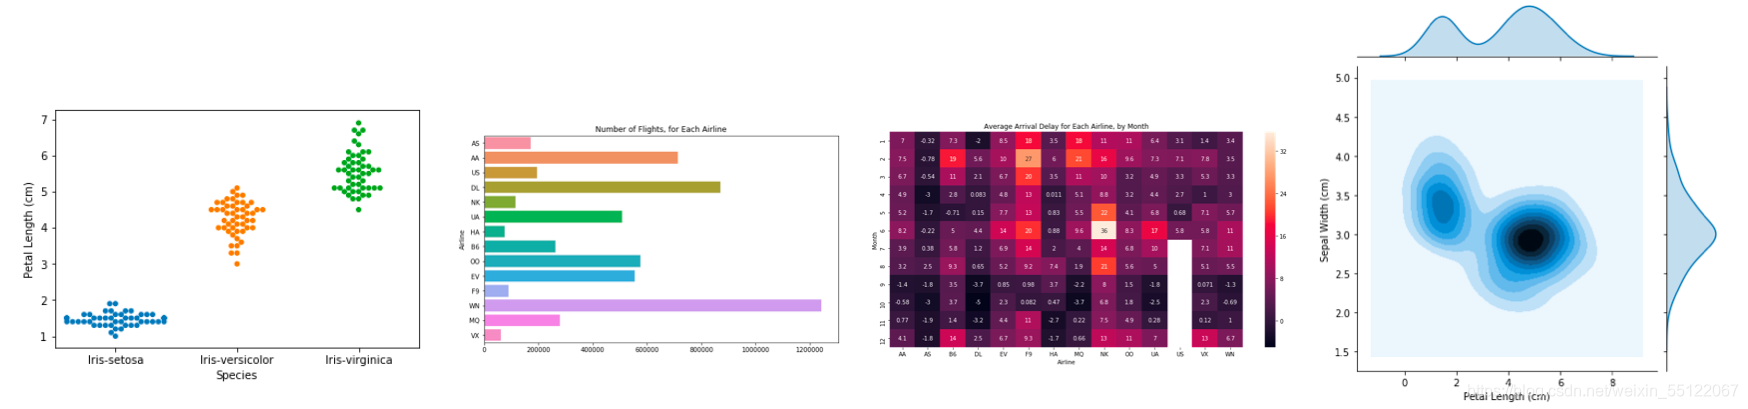
因此,如果你从未写过一行代码,并且你想要学习最少的东西就能开始快速地制作更吸引人的图,那么你来对地方了。先看一下你将学习制作的图表,如下:
1.2 你的编码环境
抓紧时间,现在快速翻到本页最下面。你将注意到有许多不同类型的信息,包括:
- text 正如你现在在阅读的
- code 包含在灰色格子里的叫做code cell
- code output 打印在屏幕上的代码运行结果
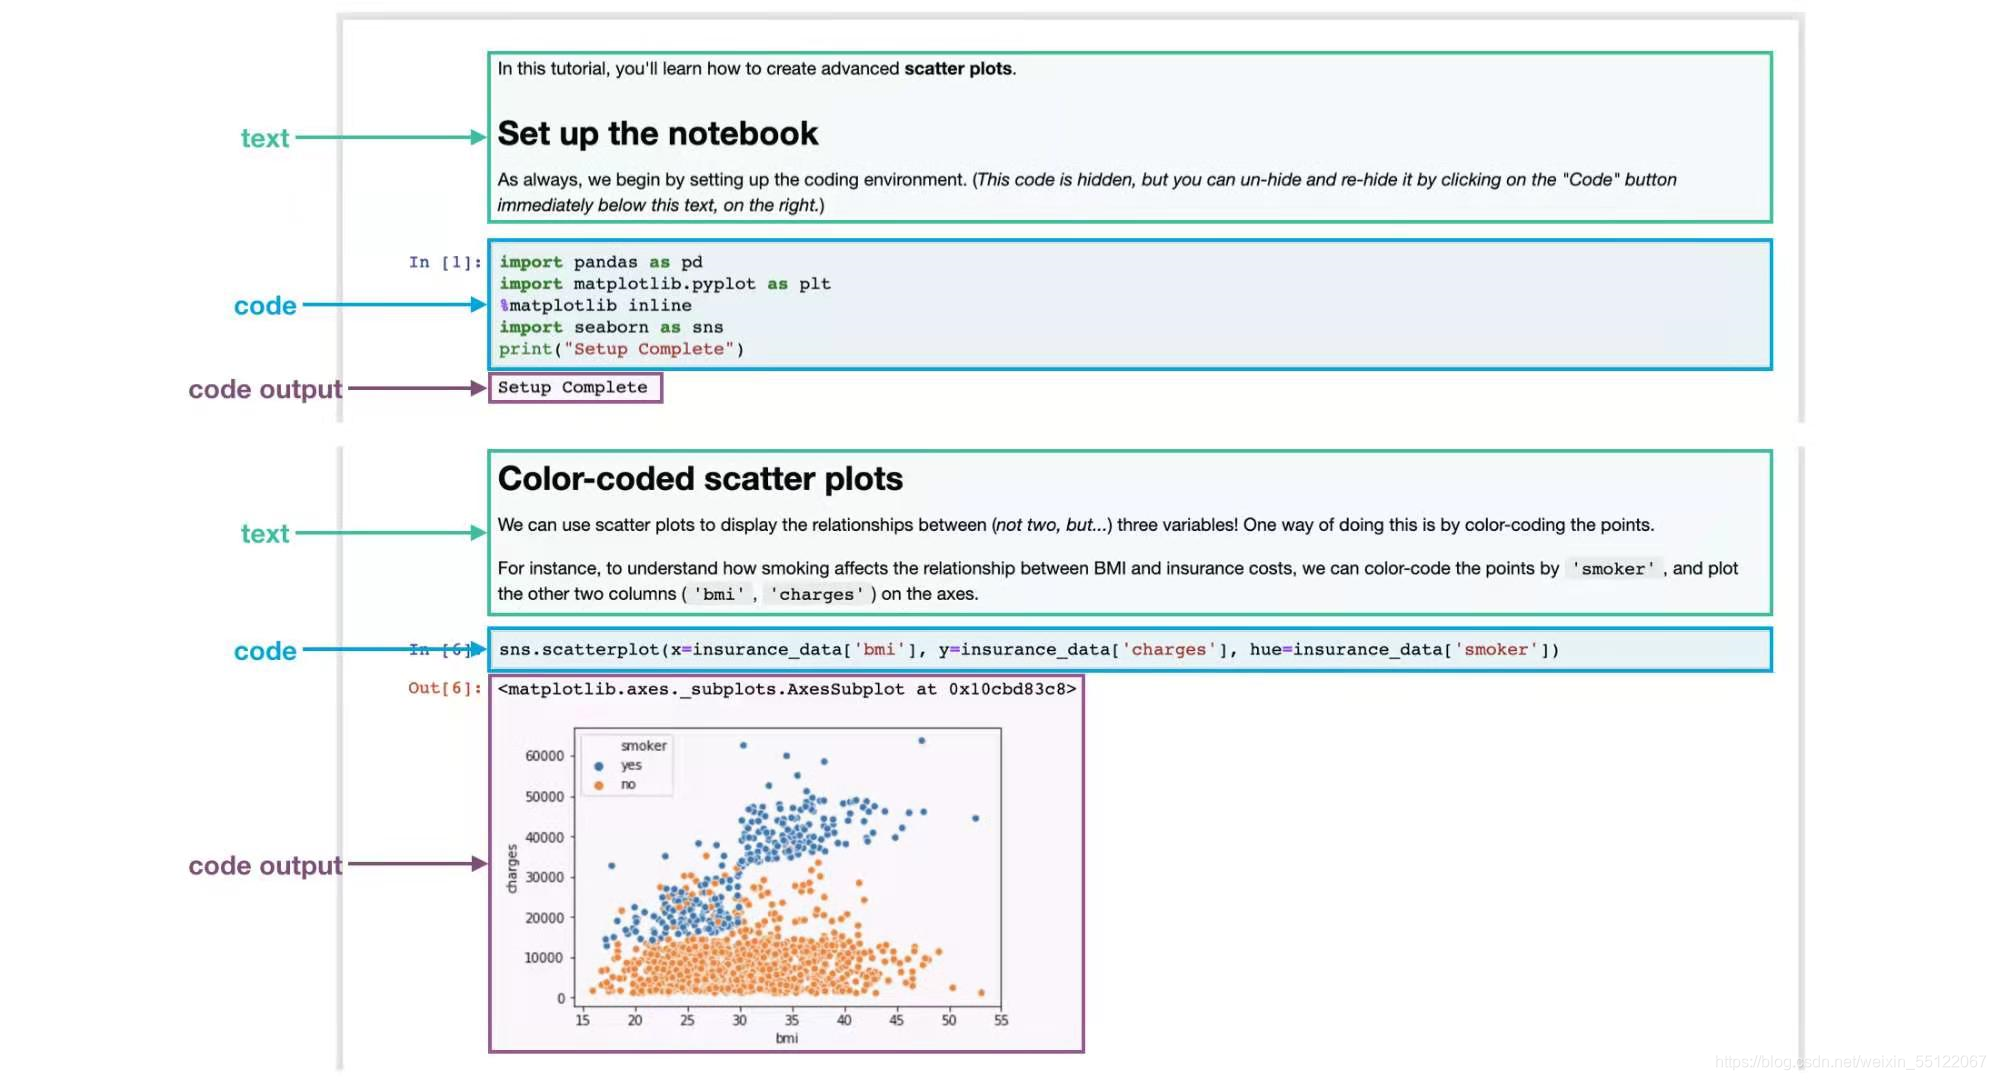
在本节内容中,我们已经运行了所以的代码。很快,你将学习使用notebook来写下和运行你的代码。
1.3 set up the notebook
在每一节notebook练习中的顶端,你需要运行几行代码来设置你的编码环境。现在理解这些代码并不重要,因此我们不会深入讨论(注意:运行结束后会输出setup complete)
import pandas as pd
pd.plotting.register_matplotlib_converters()
import matplotlib.pyplot as plt
%matplotlib inline
import seaborn as sns
print("Setup Complete")
Setup Complete
1.4 加载数据
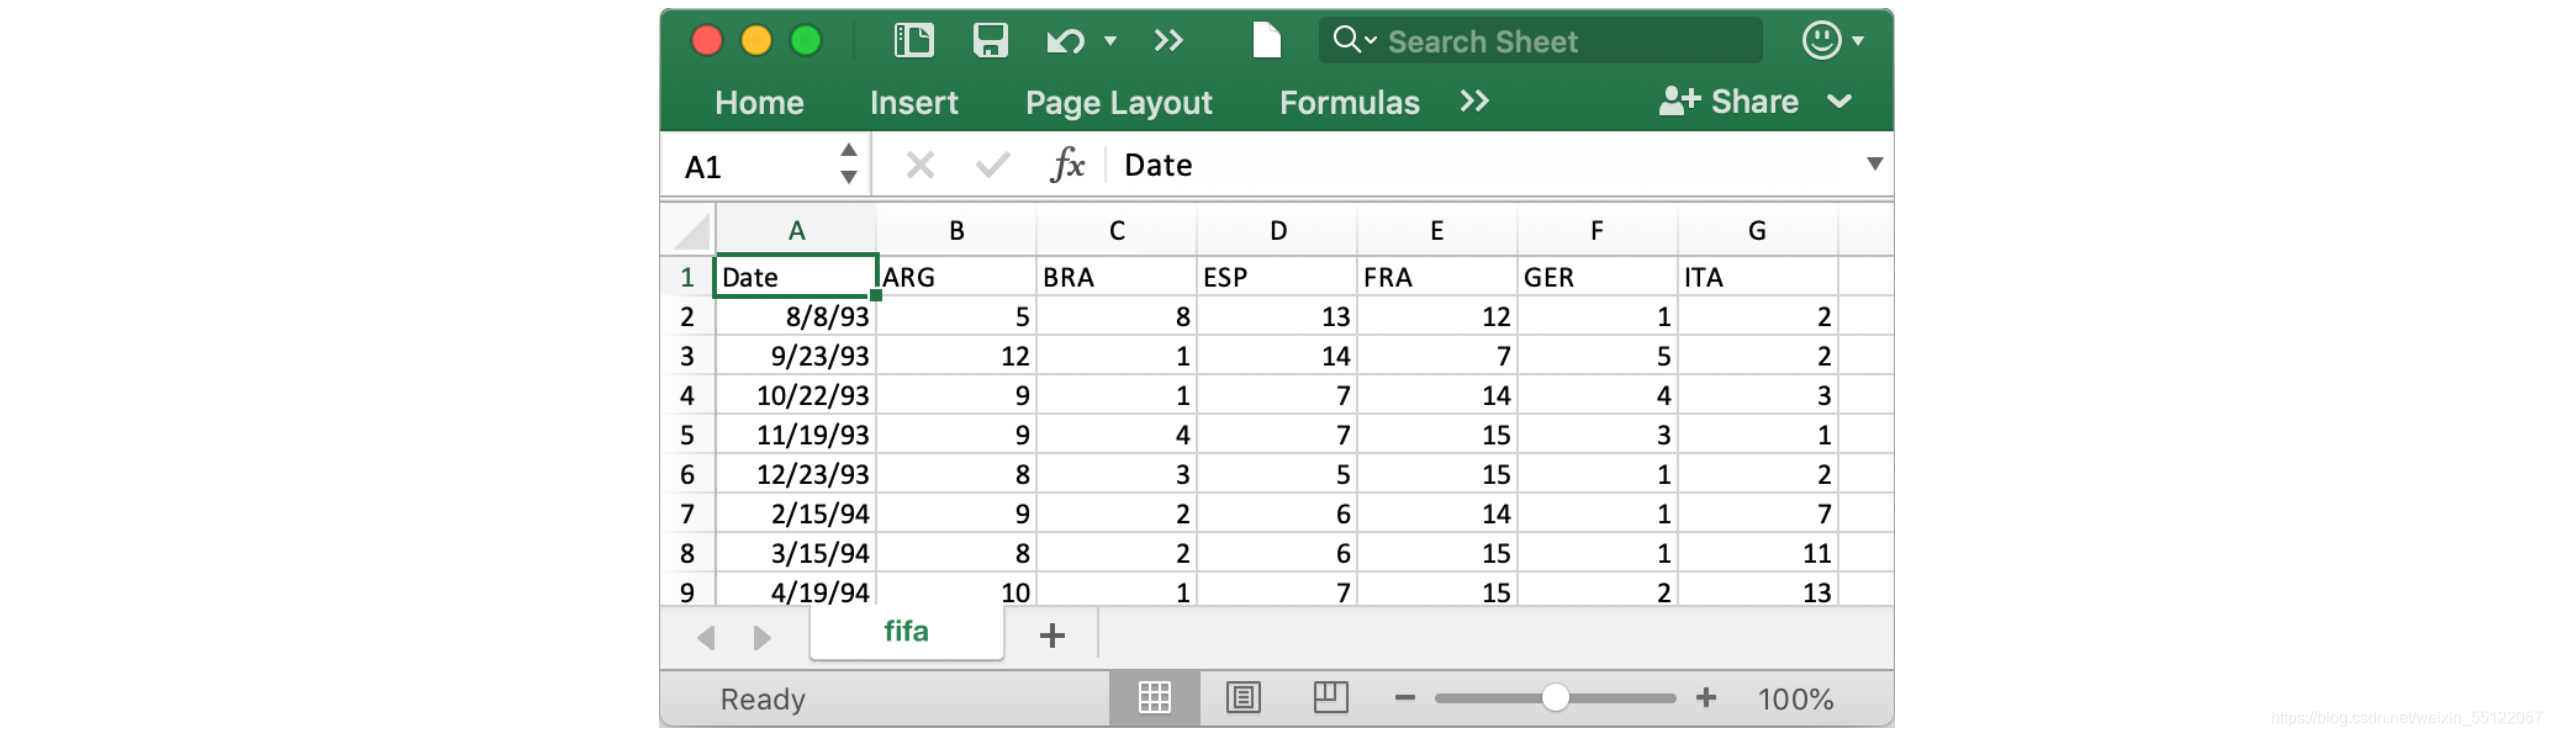
在notebook中,我们将使用六个国家的FIFA历史排名数据集:Argentina (ARG), Brazil (BRA), Spain (ESP), France (FRA), Germany (GER), and Italy (ITA)。该数据集存储于csv文件( comma-separated values file的缩写),在excel中打开csv文件,每一行为数据,对应每个国家一列。
为了加载数据,我们使用两个步骤如下:
- 设置数据的访问路径filepath
- 加载
# Path of the file to read
fifa_filepath = "../input/fifa.csv"

# Read the file into a variable fifa_data
fifa_data = pd.read_csv(fifa_filepath, index_col="Date", parse_dates=True)

1.5 检查数据
现在,我们快速浏览fifa_data数据,确认是否正确。
打印前五行数据通过head()方法:
# Print the first 5 rows of the data
fifa_data.head()
			ARG	BRA	ESP	FRA	GER	ITA
Date
1993-08-08	5.0	8.0	13.0 12.0 1.0 2.0
1993-09-23	12.0 1.0 14.0 7.0 5.0 2.0
1993-10-22	9.0	1.0	7.0 14.0 4.0 3.0
1993-11-19	9.0	4.0	7.0 15.0 3.0 1.0
1993-12-23	8.0	3.0	5.0 15.0 1.0 2.0
1.6 绘制数据
快速阅览你将学习的内容,通过如下的代码生成一个线形图表。
# Set the width and height of the figure
plt.figure(figsize=(16,6))

# Line chart showing how FIFA rankings evolved over time
sns.lineplot(data=fifa_data)
<matplotlib.axes._subplots.AxesSubplot at 0x7f85ec3769d0>
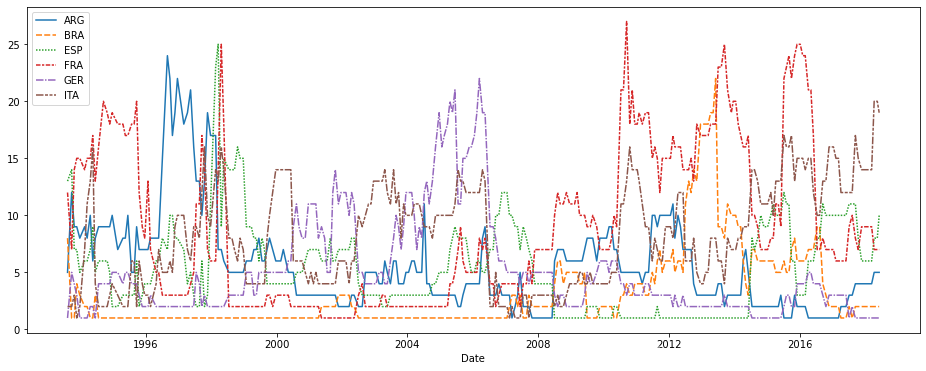
仅仅如此没什么意义,你将在下面的课程中学到更多的内容。
2.线性图表 Line Charts
-未完待续-