前言
直线检测是计算机视觉领域的基础任务,广泛应用于自动驾驶、机器人导航和图像分割等场景。OpenCV作为开源的计算机视觉和机器学习库,提供了强大的图像处理功能。本文将介绍如何使用OpenCV进行直线检测并计算直线角度,为读者提供实用的技术指南。通过本文的学习,读者将掌握使用OpenCV进行直线检测和角度计算的基本方法,为后续图像处理和计算机视觉任务打下坚实基础。
一、直线检测
在开发自动驾驶或路径跟随系统时,如无人机或简易汽车,检测并提取图像中的直线是至关重要的。这些系统需要识别道路边界、车道线或其他关键特征,以便进行路径规划或车辆分类。OpenCV库提供了强大的工具,如HoughLines()和HoughLinesP()函数,用于检测直线。这些函数能够有效地从图像中提取直线信息,为后续的图像处理和计算机视觉任务提供基础。
其中:
HoughLinesP可以检测碎片或不连续线(例如图像中的虚线或线段)时更有效。它提供有关检测到的线路的更多详细信息。
HoughLines更适合检测完整、连续的线条。当检测图像中长的、不间断的线条时,它非常有用。
本次项目我们检测不连续的线段的角度,如下图所示

故选择HoughLinesP函数,cv2.HoughLinesP 是 OpenCV 库中的一个函数,用于检测图像中的直线。它实现了概率霍夫变换(Probabilistic Hough Transform),这是一种用于检测图像中直线的方法。概率霍夫变换是对标准霍夫变换的优化,它只考虑图像中的一部分点,而不是所有点,从而提高了处理速度。使用方法如下:
cv2.HoughLinesP(image, rho, theta, threshold, minLineLength=None, maxLineGap=None)
image:输入的灰度图像。
rho:以像素为单位的距离精度,用于累加器坐标空间中的距离分辨率。
theta:以弧度为单位的角精度,用于累加器坐标空间中的角度分辨率。
threshold:累加器阈值,用于确定哪些线段被认为是真正的直线。只有当累加器中的值大于此阈值时,才会检测到一条直线。
minLineLength(可选):最小线段长度。小于此长度的线段将被忽略。
maxLineGap(可选):线段之间的最大间隙。如果两条线段之间的间隙小于此值,它们将被合并为一条直线。
函数返回值是一个包含检测到的直线信息的列表,每个元素是一个包含两个点的元组,表示一条直线的起点和终点。这些点以 (x1, y1, x2, y2) 的形式给出,其中 (x1, y1) 和 (x2, y2) 分别是直线的起点和终点的坐标。
cv2.HoughLinesP 函数在处理包含直线的图像时非常有效,尤其是在需要实时处理或处理大量图像时。它广泛应用于自动驾驶、机器人导航、图像分割等领域,为后续的图像处理和计算机视觉任务提供基础。
直线检测代码:
gray = cv2.cvtColor(image, cv2.COLOR_BGR2GRAY)
# extract edges with canny edge detector
edges = cv2.Canny(gray, 50, 150, apertureSize=3)
# apply HoughLinesP
# cv2.HoughLinesP() returns an array of lines detected in the image.
lines = cv2.HoughLinesP(edges, 1, np.pi / 180, threshold=30, minLineLength=50, maxLineGap=20)
二、角度计算
在获取到直线之后只需要根据公式:
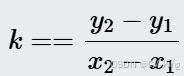
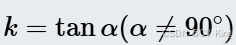
即可求出直线的角度
代码为:
dy = (y2 - y1)
dx = (x2 - x1)
        # convert radian to degree and extract angle
angle = np.rad2deg(np.arctan2(dy, dx))
        # Since the Y-axis increases downwards(in opencv), invert the angle.
angle = 180 - angle if angle > 0 else -angle
三、整体代码
import cv2
import numpy as np

image = cv2.imread(r"F:\surround-view-system-introduction-master\img.png")
# conert image to gray
gray = cv2.cvtColor(image, cv2.COLOR_BGR2GRAY)


# extract edges with canny edge detector
edges = cv2.Canny(gray, 50, 150, apertureSize=3)

# apply HoughLinesP
# cv2.HoughLinesP() returns an array of lines detected in the image.
lines = cv2.HoughLinesP(edges, 1, np.pi / 180, threshold=30, minLineLength=50, maxLineGap=20)

if lines is not None:
    for i, line in enumerate(lines):
        x1, y1, x2, y2 = line[0]
        dy = (y2 - y1)
        dx = (x2 - x1)
        # convert radian to degree and extract angle
        angle = np.rad2deg(np.arctan2(dy, dx))

        # Since the Y-axis increases downwards(in opencv), invert the angle.
        angle = 180 - angle if angle > 0 else -angle

        # different color for every line
        color = tuple(np.random.randint(0, 255, 3).tolist())

        # detected line
        cv2.line(image, (x1, y1), (x2, y2), color, 3)
        # draw shape to starting and finishing points of lines
        cv2.putText(image, '>', (x1, y1), cv2.FONT_HERSHEY_SIMPLEX, 1, (255, 255, 255), 3)
        cv2.putText(image, '<', (x2, y2), cv2.FONT_HERSHEY_SIMPLEX, 1, (255, 255, 255), 3)
        # angle
        cv2.putText(image, str(round(angle, 1)), (x1, int((y1 + y2) / 2)), cv2.FONT_HERSHEY_SIMPLEX, 1, color, 3)
        cv2.imshow("Ccc",image)
        cv2.waitKey(0)
效果:
