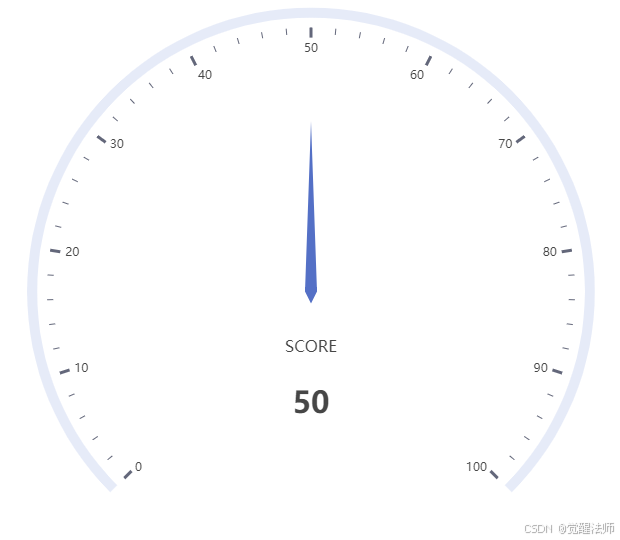
在ECharts中,可以通过仪表盘、饼图、自定义图表等功能组合,实现下图中未闭合的圆环进度条效果。仅需要以下几步即可完成:
- 使用仪表盘可绘制未闭合圆环的进度条(即未完成部分进度和已完成部分进度),以及文字部分。
- 使用饼图可绘制出中间透明扇形区域,根据进度条长度变换其面积大小。
- 使用自定义图表绘制已完成进度条末端上白色圆点,以及文字下面的底图。
接下来,将通过上述顺序完成图表的绘制。

一、创建组件
在Vue项目中,创建页面用于绘制图表模板,引入对应页面并初始化组件。代码如下:
<template>
  <div class="chart-box" ref="chart"></div>
</template>
<script>
import { } from './optinos'
export default {
  data () {
    return {
      chartDom: null
    }
  },
  mounted () {
    this.$nextTick(() => {
      this.initialChart()
    })
  },
  methods: {
    initialChart () {
      // 初始化画板
      this.chartDom = this.$echart.init(this.$refs['chart'])
      this.renderChart()
    },
    renderChart () {
      this.chartDom.setOption(chartOptions({name: '贮藏率', value: 70}))
    }
  }
}
</script>
<style lang="less" scoped>
.chart-box {
  width: 100%;
  height: 300px;
  margin: 0 auto;
}
</style>
将配置项单独存放在options.js文件中,通过export导入到页面中后再使用。
二、仪表盘绘制进度条
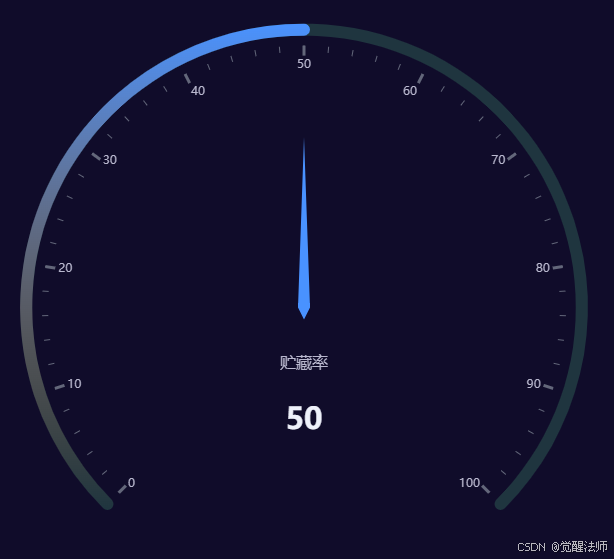
打开ECharts官网,将以下仪表盘图表修改为我们需要的圆环进度条效果。参考地址:Examples - Apache ECharts
2.1 绘制进度条
配置项代码如下:
option = {
  tooltip: {
    show: false
  },
  series: [
    {
      type: 'gauge',
      // 已完成 - 进度条样式
      progress: {
        show: true,
        width: 12,
        roundCap: true,
        itemStyle: {
          color: new echarts.graphic.LinearGradient(0, 0, 0, 1, [
            {
              offset: 0,
              color: '#4992FF'
            },
            {
              offset: 1,
              color: 'rgba(233, 144, 82, 0)'
            }
          ])
        }
      },
      // 未完成 - 进度条样式
      axisLine: {
        roundCap: true,
        lineStyle: {
          width: 12,
          color: [
            [0.1, '#1F353F'],
            [1, '#1F353F']
          ]
        }
      },
      // 显示百分比 - 数值
      detail: {
        formatter: '{value}'
      },
      data: [
        {
          value: 50,
          name: '贮藏率'
        }
      ]
    }
  ]
};
页面效果如下图:
2.2 隐藏刻度
此时,进度条效果已呈现出来,接下来将刻度、指数和指针影响掉等全部影响掉。配置项代码如下:
option = {
  tooltip: {
    show: false
  },
  series: [
    {
      type: 'gauge',
      // 已完成 - 进度条样式
      progress: {
        show: true,
        width: 12,
        roundCap: true,
        itemStyle: {
          color: new echarts.graphic.LinearGradient(0, 0, 0, 1, [
            {
              offset: 0,
              color: '#4992FF'
            },
            {
              offset: 1,
              color: 'rgba(233, 144, 82, 0)'
            }
          ])
        }
      },
      // 未完成 - 进度条样式
      axisLine: {
        roundCap: true,
        lineStyle: {
          width: 12,
          color: [
            [0.1, '#1F353F'],
            [1, '#1F353F']
          ]
        }
      },
      detail: {
        formatter: '{value}'
      },
      axisTick: {
        show: false
      },
      splitLine: {
        show: false
      },
      axisLabel: {
        show: false
      },
      pointer: {
        show: false
      },
      data: [
        {
          value: 50,
          name: '贮藏率'
        }
      ]
    }
  ]
};
页面效果如下图:
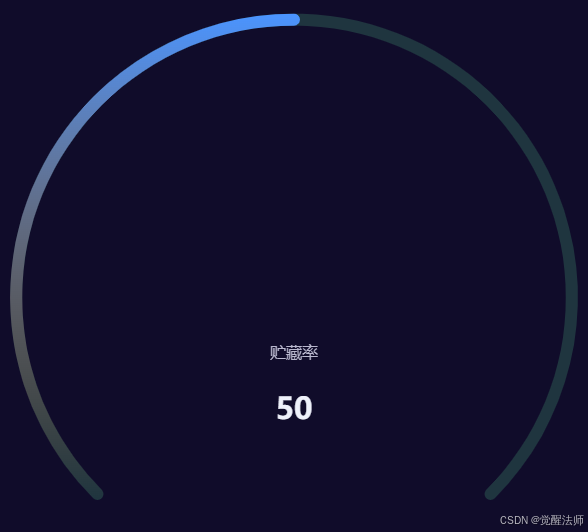
2.3 显示文字
将百分比调整到圆环中间位置 ,并且添加百分号。另外标题下移,调大字体。配置代码如下:
option = {
  tooltip: {
    show: false
  },
  series: [
    {
      type: 'gauge',
      // 已完成 - 进度条样式
      progress: {
        show: true,
        width: 12,
        roundCap: true,
        itemStyle: {
          color: new echarts.graphic.LinearGradient(0, 0, 0, 1, [
            {
              offset: 0,
              color: '#4992FF'
            },
            {
              offset: 1,
              color: 'rgba(233, 144, 82, 0)'
            }
          ])
        }
      },
      // 未完成 - 进度条样式
      axisLine: {
        roundCap: true,
        lineStyle: {
          width: 12,
          color: [
            [0.1, '#1F353F'],
            [1, '#1F353F']
          ]
        }
      },
      axisTick: {
        show: false
      },
      splitLine: {
        show: false
      },
      axisLabel: {
        show: false
      },
      pointer: {
        show: false
      },
      title: {
        show: true,
        offsetCenter: [0, '100%'],
        fontSize: 40,
        color: '#4992FF'
      },
      detail: {
        valueAnimation: true,
        fontSize: 50,
        color: '#4992FF',
        offsetCenter: [0, 0],
        formatter: v => v + '%'
      },
      data: [
        {
          value: 50,
          name: '贮藏率'
        }
      ]
    }
  ]
};
页面效果如下图: