一 安装Go语言
tar -C /usr/local -xzf go1.8.3.linux-amd64.tar.gz
(选择自己的路径,和自己的路径对应)
配置环境变量:
vim /etc/profile
在文件的最后添加如下内容:
export PATH=$PATH:/usr/local/go/bin
(选择自己的路径,和自己的路径对应)
保存退出后,接着让配置文件立刻生效:
source /etc/profile
验证一下是否成功,用go version 来验证
[root@hdp-1 etc]# go version
二 安装prometheus
mkdir  /root/apps
tar -zvxf prometheus-2.22.1.linux-amd64.tar.gz -C /root/apps
目录底下的内容
[root@localhost prometheus-2.22.1.linux-amd64]# ll
总用量 170556
-rw-r--r--. 1 root root     2402 4月   6 20:35 a.txt
drwxr-xr-x. 2 3434 3434       38 11月  5 2020 console_libraries
drwxr-xr-x. 2 3434 3434      190 4月   6 02:28 consoles
drwxr-xr-x. 8 root root      206 4月   6 23:00 data
-rw-r--r--. 1 3434 3434    11357 11月  5 2020 LICENSE
-rw-------. 1 root root    15523 4月   6 23:00 nohup.out
-rw-r--r--. 1 3434 3434     3420 11月  5 2020 NOTICE
-rwxr-xr-x. 1 3434 3434 87734252 11月  5 2020 prometheus
-rw-r--r--. 1 3434 3434     3977 4月   6 18:21 prometheus.yml
-rwxr-xr-x. 1 3434 3434 77801592 11月  5 2020 promtool
drwxr-xr-x. 2 3434 3434      120 4月   6 20:34 pushgateway
-rw-r--r--. 1 root root       75 4月   6 18:22 pushgateway.log
-rw-r--r--. 1 root root  9061204 4月   6 16:00 pushgateway.tar.gz
修改这个yml很重要
# prometheus.yml - 重写并带有详细注释的配置

# 全局配置 (Global Settings)
# 这些设置是 Prometheus 实例的默认值,除非在特定的抓取配置中被覆盖。
global:
  # scrape_interval: 定义了 Prometheus 从目标抓取指标的默认频率。
  # 每 15 秒抓取一次数据。
  scrape_interval: 15s

  # evaluation_interval: 定义了 Prometheus 评估记录规则和告警规则的频率。
  # 每 15 秒评估一次规则。
  evaluation_interval: 15s

  # external_labels: (可选) 添加到所有时间序列和告警的标签,用于与其他系统(如 Alertmanager)交互。
  # 示例:
  # external_labels:
  #   monitor: 'my-prometheus-instance'

# 告警配置 (Alerting Configuration)
# 定义 Prometheus 如何将告警发送到 Alertmanager 实例。
alerting:
  alertmanagers:
    # static_configs: 静态地定义 Alertmanager 实例的地址。
    # 当前目标列表为空,表示虽然配置了告警部分,但实际上没有配置 Alertmanager 实例。
    # 要启用告警,请在此处添加您的 Alertmanager 主机和端口。
    # 示例: targets: ['alertmanager.example.com:9093']
    - static_configs:
        - targets: [] # 未定义 Alertmanager 实例,告警功能实际上处于禁用状态。

# 规则文件 (Rule Files)
# 指定包含告警规则 (alerting rules) 和记录规则 (recording rules) 的文件路径。
# Prometheus 会根据 'evaluation_interval' 定期重新加载这些文件。
rule_files:
  # 当前未指定任何规则文件。将规则文件的路径(例如 *.rules.yml)添加到这里。
  # 示例:
  # - "rules/node_exporter_rules.yml"
  # - "rules/application_rules.yml"
  [] # 空列表表示不加载任何规则。

# 抓取配置 (Scrape Configurations)
# 定义 Prometheus 需要监控的目标(endpoints)。每个 'job' 代表一组具有共同目的的目标。
scrape_configs:
  # 作业 1: 监控 Prometheus 自身
  # 这是标准实践,用于监控 Prometheus 本身的健康状况和性能指标。
  - job_name: 'prometheus'
    # static_configs: 在配置文件中手动、静态地定义目标。
    static_configs:
      - targets: ['localhost:9090'] # Prometheus 的默认端口。

  # 作业 2: 监控 centos7-1 上的 node_exporter
  # node_exporter 提供操作系统和硬件相关的指标。
  - job_name: 'centos7-1'
    static_configs:
      - targets: ['192.168.80.131:9100'] # node_exporter 的默认端口。

  # 作业 3: 监控 centos7-2 上的 node_exporter
  - job_name: 'centos7-2'
    static_configs:
      - targets: ['192.168.80.132:9100']

  # 作业 4: 监控 centos7-3 上的 node_exporter
  - job_name: 'centos7-3'
    static_configs:
      - targets: ['192.168.80.133:9100']

  # 作业 5: 监控 MySQL 主服务器上的 node_exporter
  - job_name: 'mysql-master'
    static_configs:
      - targets: ['192.168.80.141:9100']

  # 作业 6: 监控 MySQL 从服务器 1 上的 node_exporter
  - job_name: 'mysql-slave1'
    static_configs:
      - targets: ['192.168.80.142:9100']

  # --- 已注释掉的配置 ---
  # 以下作业配置当前被注释掉了,处于禁用状态。
  # 它可能原本用于抓取 Grafana、Loki、Promtail 或运行在 192.168.80.151:9091 上的其他服务的指标。
  # 如果需要启用,请移除下面几行开头的 '#' 符号。
  # 抓取 PushGateway 指标
  - job_name: 'flink-pushgateway'
    static_configs:
      - targets: ['192.168.80.151:9091']  # 因为 PushGateway 与 Prometheus 在同一机器

# --- 替代方案提示 ---
# 对于管理大量类似目标(如此处的多个 node_exporter 实例),
# 可以考虑使用服务发现机制(Service Discovery)替代 static_configs,例如:
# - file_sd_configs: 从文件中读取目标列表(JSON 或 YAML 格式)。
# - consul_sd_configs, kubernetes_sd_configs, ec2_sd_configs 等:与 Consul、Kubernetes、AWS EC2 等集成。
# 这样做可以使配置更动态、更易于管理。
配置完后运行
[root@archive prometheus]# ./prometheus
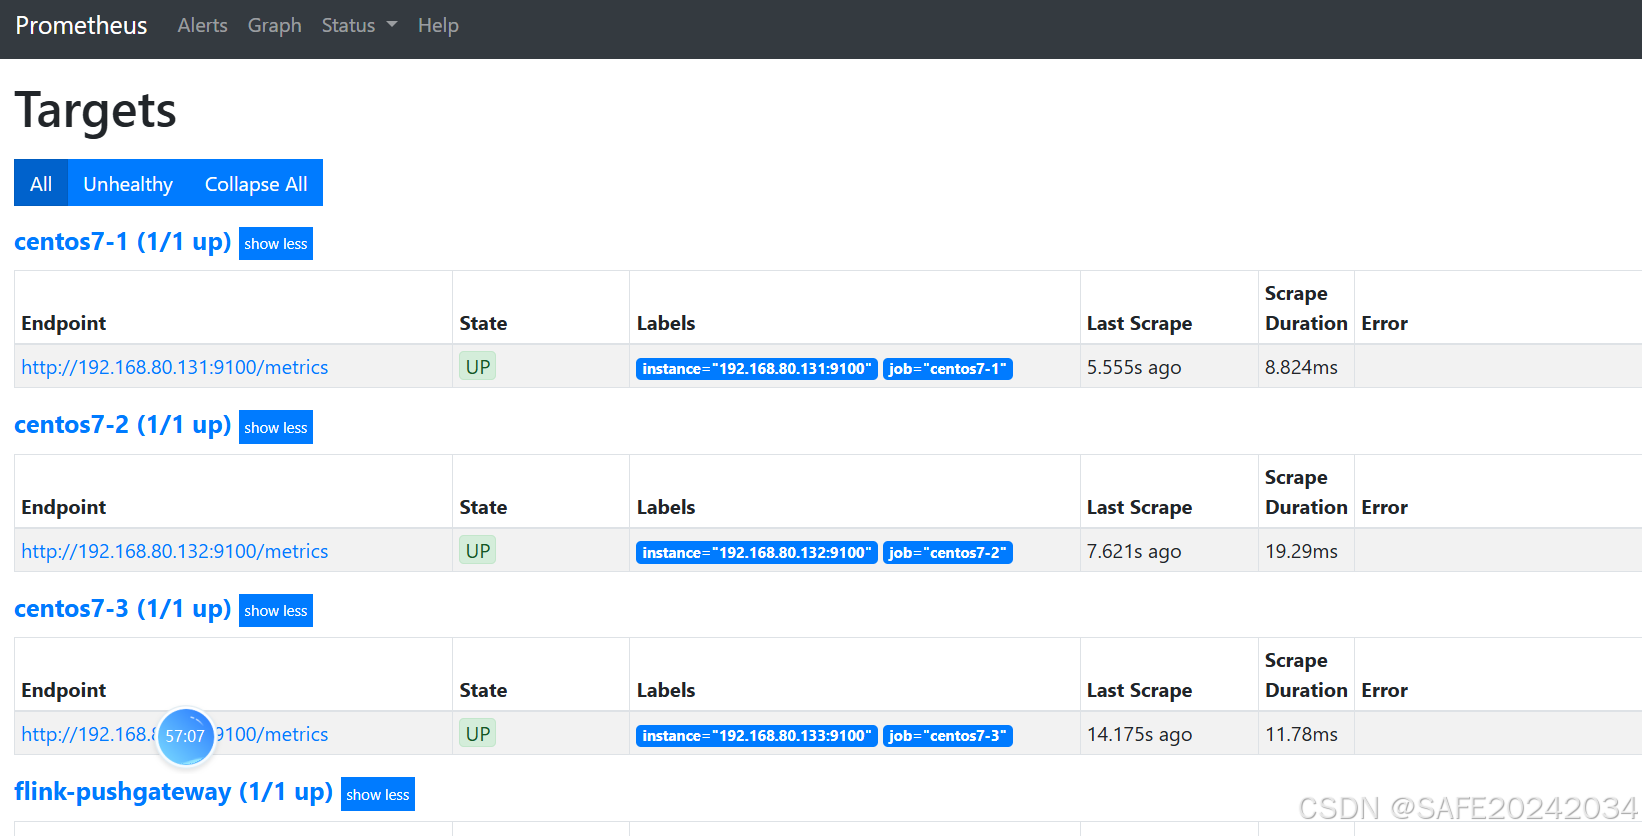
点击targets 跳转到监控目标,这里展
现了多个监控对象。红框的表示部署的prometheus
http://192.168.80.151:9090/targets
在这里插入代码片
三 安装node_expoter
给被监控的服务器装一个采集点
node_exporter-0.16.0.linux-amd64.tar.gz
tar xvf node_exporter-1.0.1.linux-amd64.tar.gz -C /root/apps
nohup /usr/local/node_exporter-1.0.1.linux-amd64/node_exporter &
四 安装zookeeper
  519  tar -zxvf zookeeper-3.4.14.tar.gz
  520  ll
  521  cd zookeeper-3.4.14
  522  pwd
  523  mkdir /root/apps/zookeeper-3.4.14/data
  524  mkdir /root/apps/zookeeper-3.4.14/data/logs
  525  cd conf
  526  ll
  527  host
  528  hostname
  529  ll
  530  mv zoo_sample.cfg zoo.cfg
  531  cd ../data
  532  touch myid
  533  echo 1 myid
  534  echo 1 >myid
  535  cat myid
  536  cd ../
  537  cd ,,.
  538  cd ../
  539  rsync-scripts /root/apps/zookeeper-3.4.14
  540  cd zookeeper-3.4.14
  541  ll
  542  cd bin
  543  pwd
  544  ./zkServer.sh
  545  ./zkServer.sh start
  546  ./zkServer.sh status
  547  pwd
  548  cd ../
  549  ll
主要就是修改了个这个目录
mv zoo_sample.cfg zoo.cfg
五安装flink
  508  tar -zvxf flink-1.11.1-bin-scala_2.12.tgz
  509  ll
  510  cd flink-1.11.1
  511  ll
  512  cd conf
  513  ll
  514  cd ../
  515  ll
  516  pwd
  517  rsync-scripts /root/apps/flink-1.11.1
  518  jps
flink/conf/flink-conf.yaml
改了一个名字
jobmanager.rpc.address: centos7-1
jobmanager.rpc.port: 6123
# 指定 Prometheus PushGateway Reporter
metrics.reporter.promgateway.class: org.apache.flink.metrics.prometheus.PrometheusPushGatewayReporter

# PushGateway 的地址(监控节点)
metrics.reporter.promgateway.host: 192.168.80.151
metrics.reporter.promgateway.port: 9091

# 任务名(可带随机后缀避免覆盖)
metrics.reporter.promgateway.jobName: flink-job
metrics.reporter.promgateway.randomJobNameSuffix: true

# 不在 Flink 关闭时删除 job 的 metrics
metrics.reporter.promgateway.deleteOnShutdown: false
六 安装pushgateway
将多个节点数据汇总到 pushgateway, 如果 pushgateway 挂了,受影响比多个 target 大。
Prometheus 拉取状态 up 只针对 pushgateway, 无法做到对每个节点有效。
Pushgateway 可以持久化推送给它的所有监控数据。
http://192.168.80.151:9091/#
解压放在这里了
[root@localhost prometheus-2.22.1.linux-amd64]# ll
总用量 170556
-rw-r--r--. 1 root root     2402 4月   6 20:35 a.txt
drwxr-xr-x. 2 3434 3434       38 11月  5 2020 console_libraries
drwxr-xr-x. 2 3434 3434      190 4月   6 02:28 consoles
drwxr-xr-x. 8 root root      206 4月   6 23:00 data
-rw-r--r--. 1 3434 3434    11357 11月  5 2020 LICENSE
-rw-------. 1 root root    15523 4月   6 23:00 nohup.out
-rw-r--r--. 1 3434 3434     3420 11月  5 2020 NOTICE
-rwxr-xr-x. 1 3434 3434 87734252 11月  5 2020 prometheus
-rw-r--r--. 1 3434 3434     3977 4月   6 18:21 prometheus.yml
-rwxr-xr-x. 1 3434 3434 77801592 11月  5 2020 promtool
drwxr-xr-x. 2 3434 3434      120 4月   6 20:34 pushgateway
-rw-r--r--. 1 root root       75 4月   6 18:22 pushgateway.log
-rw-r--r--. 1 root root  9061204 4月   6 16:00 pushgateway.tar.gz
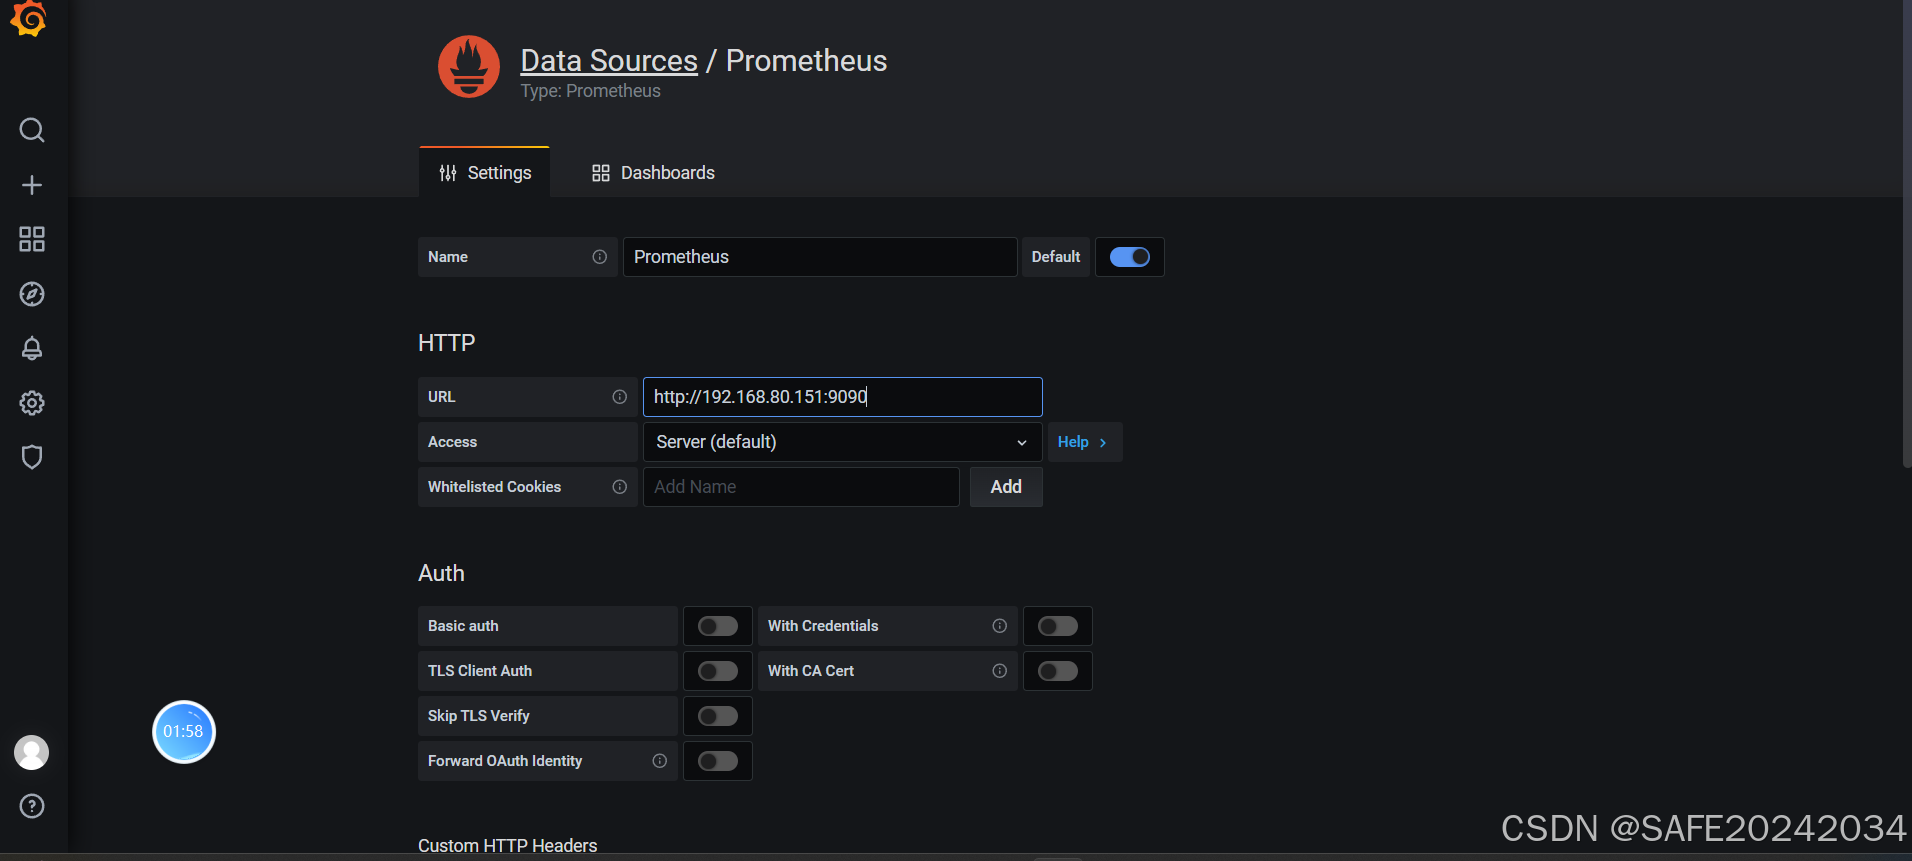
六 数据看板的配置
通过grafana工具监控,可视化效果友好
没有改配置文集,设置启动一下就好
   89  wget https://dl.grafana.com/oss/release/grafana-7.3.1-1.x86_64.rpm
   90  yum install wget
   91  wget https://dl.grafana.com/oss/release/grafana-7.3.1-1.x86_64.rpm
   92  ll
   93  yum install grafana-7.3.1-1.x86_64.rpm
   94  whereis grafana
   95  cd /usr/share/grafana
   96  ll
   97  cd bin
   98  ll
   99  systemctl start grafana-server
  100  systemctl status grafana-server
  101  cd /etc/grafana
  102  ll
  103  vim grafana.ini
http://192.168.80.151:3000/d/WjPUcKnMk/flink-dashboard?orgId=1&refresh=1h&from=now-3h&to=now

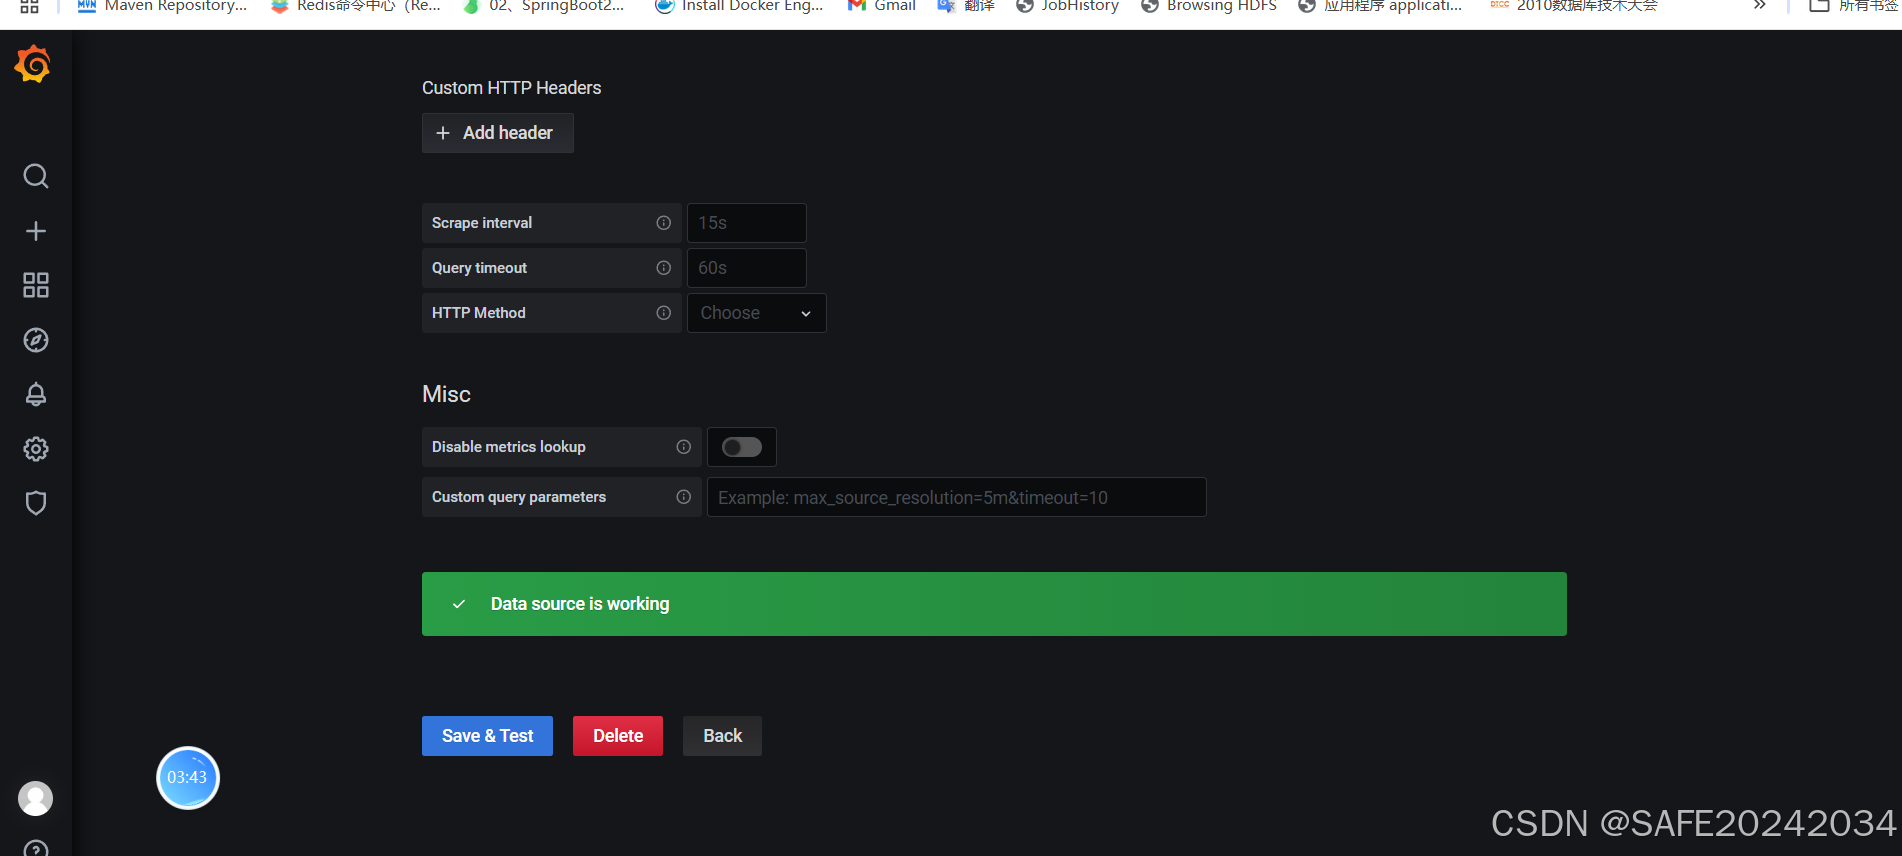
配置完成
这样不能显示默认的一个数据源

这个默认的不好看。换一个
去这个网站换
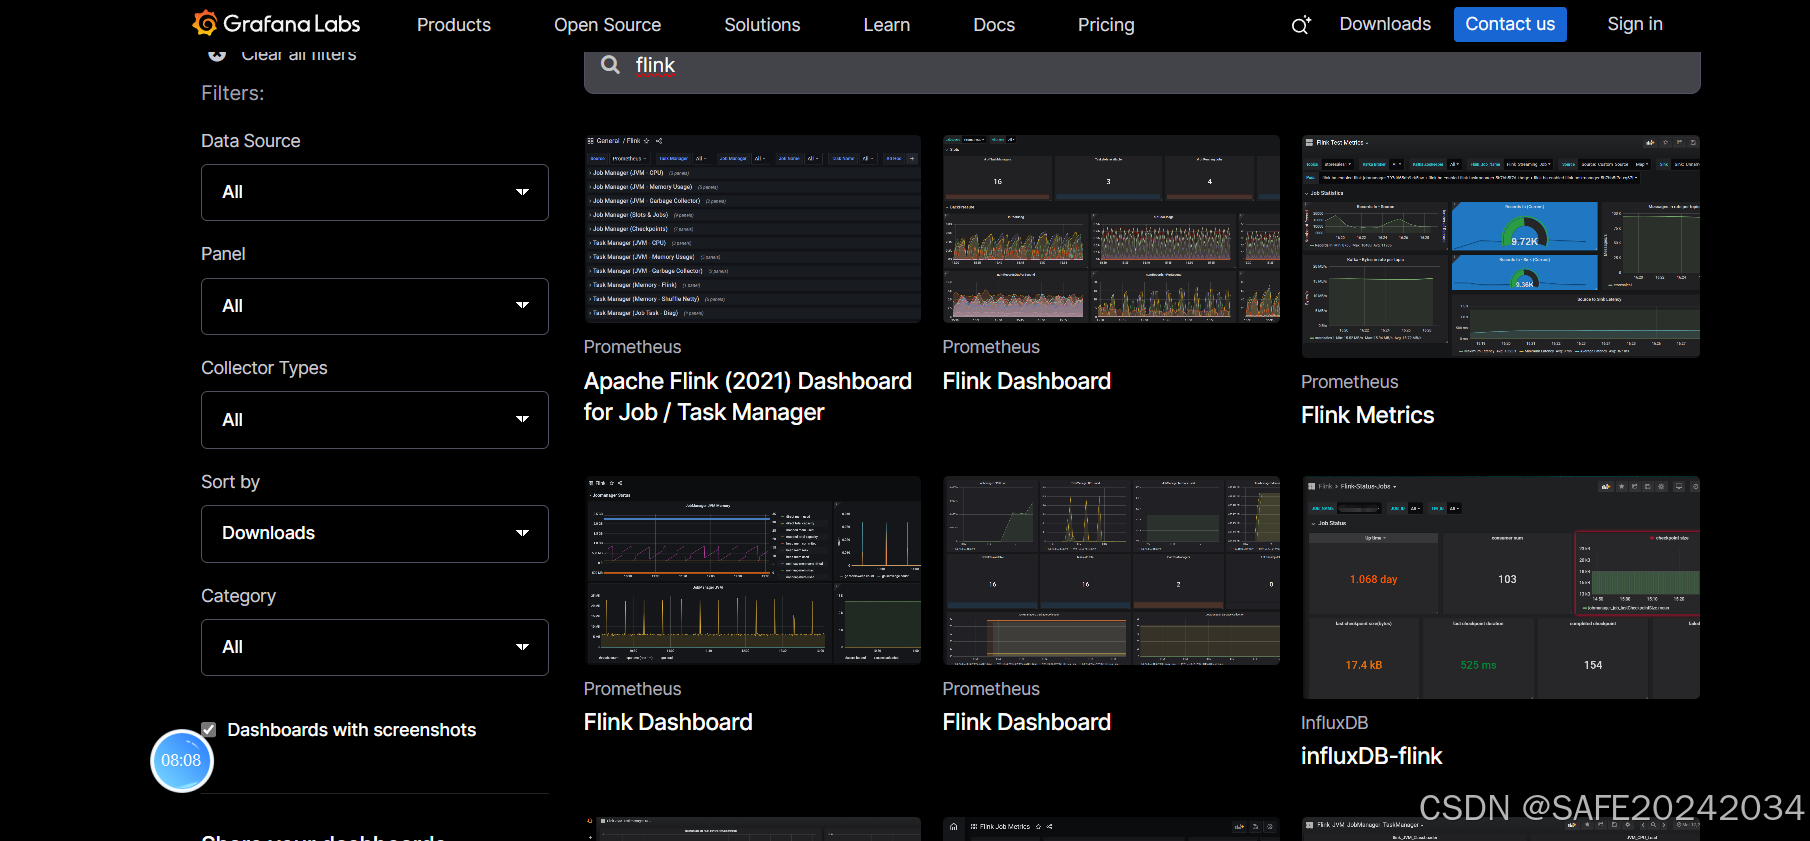
网站上有个号记下来
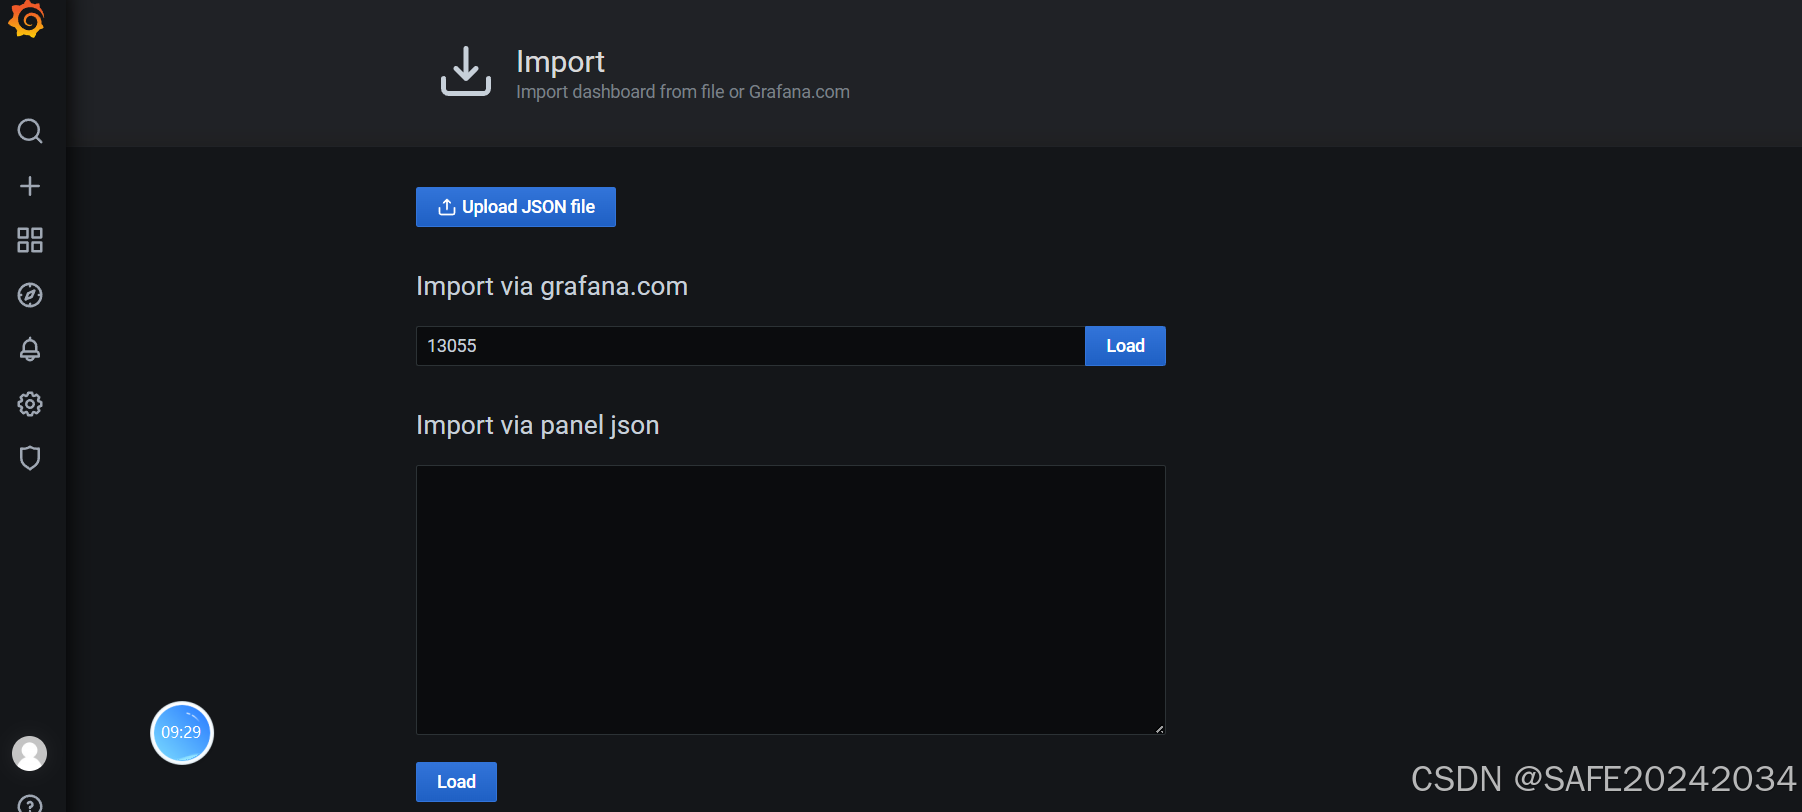
然后点击import
