对河南省的疫情进行分析
import numpy as np
import pandas as pd
import matplotlib.pyplot as plt
import requests
#请求地址
url = "http://dia.t.gdatacloud.com/api/diagnose/diagnosePeople/ageStatis"
params = {
'areaCode':410000#河南省
}
#发送get请求
response = requests.get(url, params=params)
#获取返回的json数据
s = response.json()
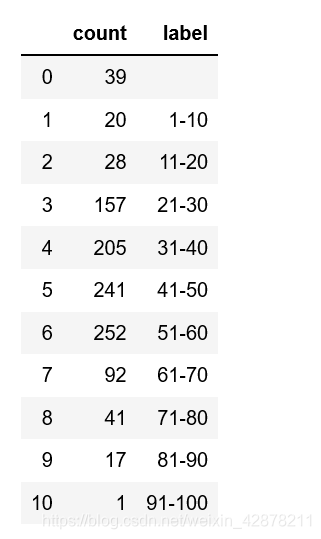
data = pd.DataFrame(s['content'])
data
运行结果:
import matplotlib.pyplot
plt.rcParams['font.sans-serif'] = ['SimHei']
plt.rcParams['axes.unicode_minus'] = False
people=['10岁以下幼儿','10-20岁青年','20-40的家庭支柱','40-60中老年人','60-80已退休老人','80岁以后的耄耋长者']
year=[0,0,0,0,0,0]
for i in data.index:
    if data.loc[i]['label'] in ['0-10']:
        year[0]+=data.loc[i]['count']
    if data.loc[i]['label'] in ['11-20']:
        year[1]+=data.loc[i]['count']
    if data.loc[i]['label'] in ['21-30','31-40']:
        year[2]+=data.loc[i]['count']
    if data.loc[i]['label'] in ['41-50','51-60']:
        year[3]+=data.loc[i]['count']
    if data.loc[i]['label'] in ['61-70','71-80']:
        year[4]+=data.loc[i]['count']
    if data.loc[i]['label'] in ['81-90','91-100']:
        year[5]+=data.loc[i]['count']
plt.title('河南省不同年龄段感染人数 王震20177710232')
plt.barh(people,year)
plt.show()
运行结果:

