Rectangle类
class matplotlib.patches.Rectangle(
    xy, width, height, angle=0.0, **kwargs)
参数
xy: 2元组 矩形左下角xy坐标
width:矩形的宽度
height:矩形的高度
angle: float, 可选,矩形相对于x轴逆时针旋转角度,默认0
fill: bool, 可选,是否填充矩形
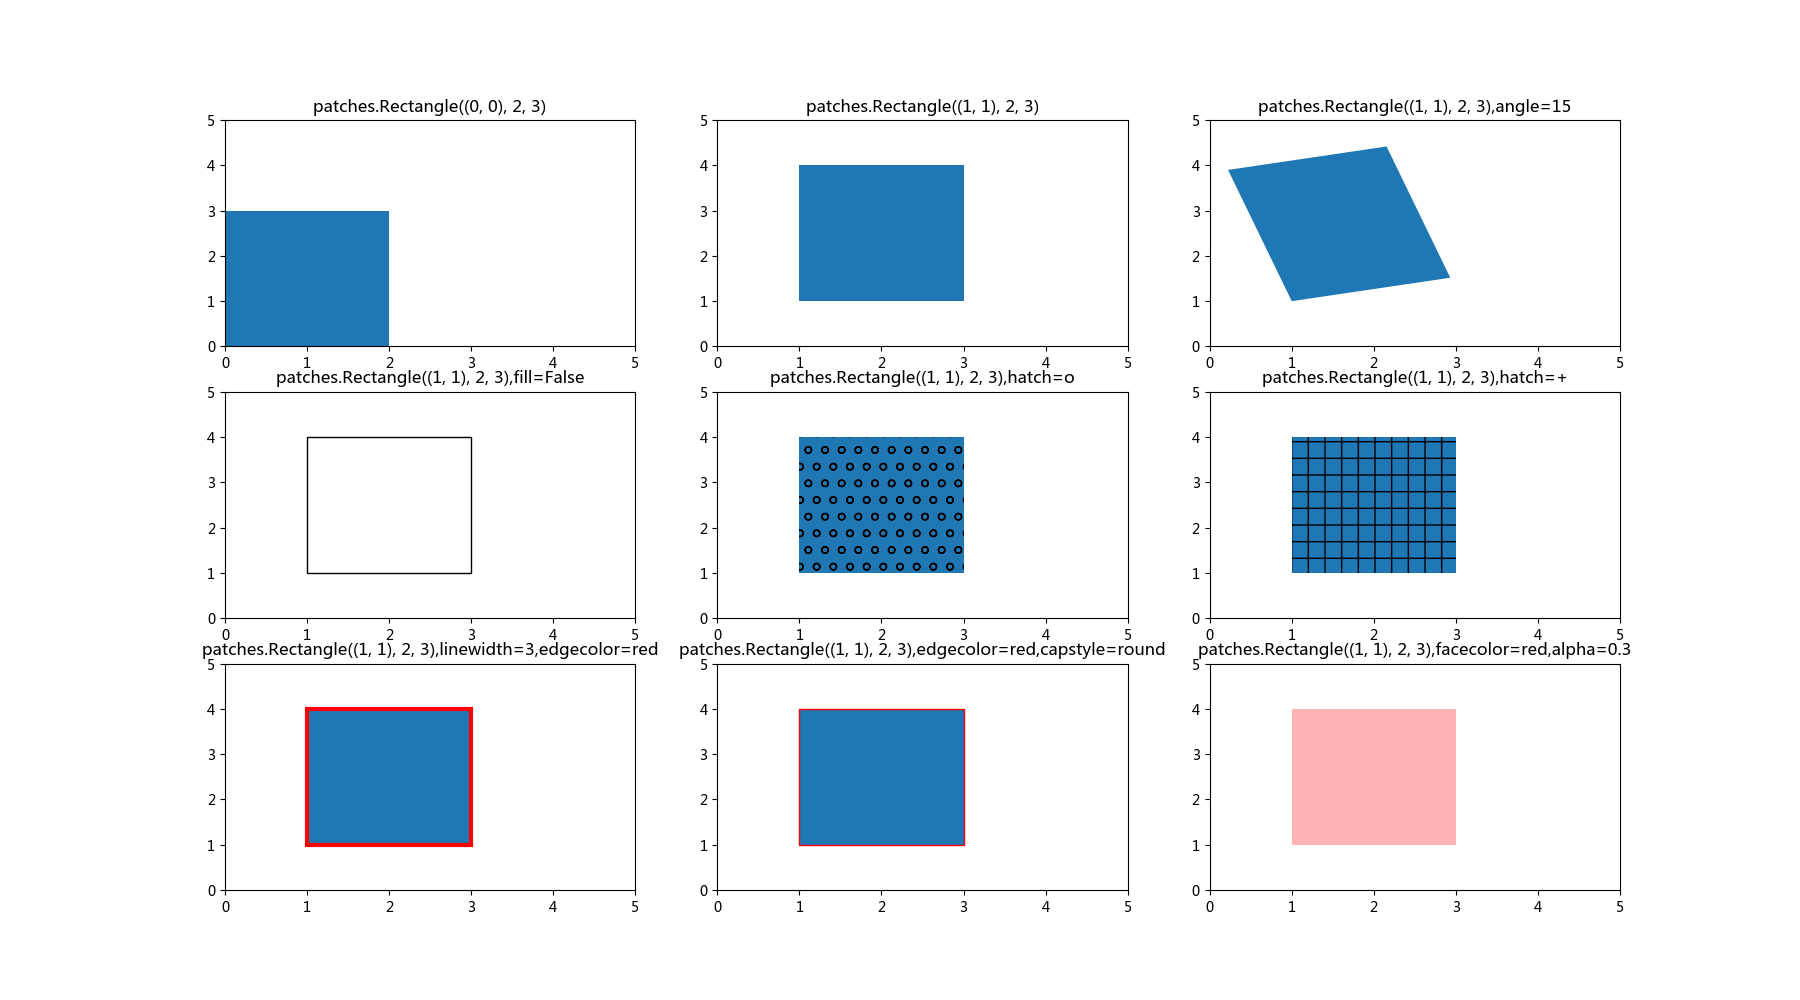
Rectangle实例参数对比
#-*-coding:utf-8-*-
import numpy as np
import matplotlib.pyplot as plt
import matplotlib.patches as patches

#将画布分为3*3,并且将画布定位到第一个axis系中
ax = plt.subplot(331)
ax.axis([0,5,0,5])
ax.add_patch(patches.Rectangle((0, 0), 2, 3))
ax.set_title("patches.Rectangle((0, 0), 2, 3)")


ax = plt.subplot(332)
ax.axis([0,5,0,5])
ax.add_patch(patches.Rectangle((1, 1), 2, 3))
ax.set_title("patches.Rectangle((1, 1), 2, 3)")


ax = plt.subplot(333)
ax.axis([0,5,0,5])
ax.add_patch(patches.Rectangle((1, 1), 2, 3,angle=15))
ax.set_title("patches.Rectangle((1, 1), 2, 3),angle=15")

ax = plt.subplot(334)
ax.axis([0,5,0,5])
ax.add_patch(patches.Rectangle((1, 1), 2, 3,fill=False))
ax.set_title("patches.Rectangle((1, 1), 2, 3),fill=False")

ax = plt.subplot(335)
ax.axis([0,5,0,5])
ax.add_patch(patches.Rectangle((1, 1), 2, 3,hatch="o"))
ax.set_title("patches.Rectangle((1, 1), 2, 3),hatch=o")


ax = plt.subplot(336)
ax.axis([0,5,0,5])
ax.add_patch(patches.Rectangle((1, 1), 2, 3,hatch="+"))
ax.set_title("patches.Rectangle((1, 1), 2, 3),hatch=+")

ax = plt.subplot(337)
ax.axis([0,5,0,5])
ax.add_patch(patches.Rectangle((1, 1), 2, 3,linewidth=3,edgecolor="red"))
ax.set_title("patches.Rectangle((1, 1), 2, 3),linewidth=3,edgecolor=red")

ax = plt.subplot(338)
ax.axis([0,5,0,5])
ax.add_patch(patches.Rectangle((1, 1), 2, 3,edgecolor="red",capstyle="round"))
ax.set_title("patches.Rectangle((1, 1), 2, 3),edgecolor=red,capstyle=round")

ax = plt.subplot(339)
ax.axis([0,5,0,5])
ax.add_patch(patches.Rectangle((1, 1), 2, 3,facecolor="red",alpha=0.3))
ax.set_title("patches.Rectangle((1, 1), 2, 3),facecolor=red,alpha=0.3")

plt.gcf().set_size_inches(18,10)
plt.savefig("rectangle.png")
plt.show()
图形大概像是这样子的:
