Path对象
class matplotlib.path.Path(
    vertices, codes=None, _interpolation_steps=1,
    closed=False, readonly=False)
参数
vertices: (N,2)维 float数组,顶点坐标
codes: N维数组,定点坐标类型,和vertices长度保持一致
code的类型:
STOP : 1个顶点,path的终点
MOVETO : 一个顶点,移动到指定的顶点
LINETO : 1个顶点,画到指定顶点的直线
CURVE3 : 1个控制点,一个终点。用指定控制点画二次赛贝尔曲线从当前位置到指定的结束位置
CURVE4 : 2个控制点,一个终点。使用指定的2个控制点从当前位置画三次赛贝尔曲线到指定的结束位置
CLOSEPOLY : 一个顶点,结束位置,从开始位置画一直线到当前位置
_interpolation_steps : int, 可选
closed : bool, 可选,如果为True,path将被当做封闭多边形
readonly : bool, 可选,是否不可变
说明
Path是通过赛贝尔曲线实现的,我们知道二次赛贝尔曲线要3个点确定,但是我们看到CURVE3只有2个点,还有一个点是当前点。
同理三次赛贝尔曲线需要4个点确定,只有3个,还有一个是当前点,作为起始点。
所有我们看到出现CURVE3必定连续出现2个,出现CURVE4必定连续出现3个。
二次赛贝尔曲线实例
#-*-coding:utf-8-*-
import matplotlib.path as mpath
import matplotlib.patches as mpatches
import matplotlib.pyplot as plt

Path = mpath.Path

fig, ax = plt.subplots()
path = Path([(0, 0), (1, 0), (1, 1), (0, 0)],[Path.MOVETO, Path.CURVE3, Path.CURVE3, Path.CLOSEPOLY])
# path = Path([(0, 0), (1, 0), (1, 1)],[Path.MOVETO, Path.CURVE3, Path.CURVE3])
pp = mpatches.PathPatch(path,fc="none", transform=ax.transData)

ax.add_patch(pp)
ax.plot([0.75], [0.25], "ro")
ax.set_title(u'红点在曲线上')

plt.savefig("redp.png")
plt.show()
上面是官网的一个实例,画出来的画风大概是下面这样的:
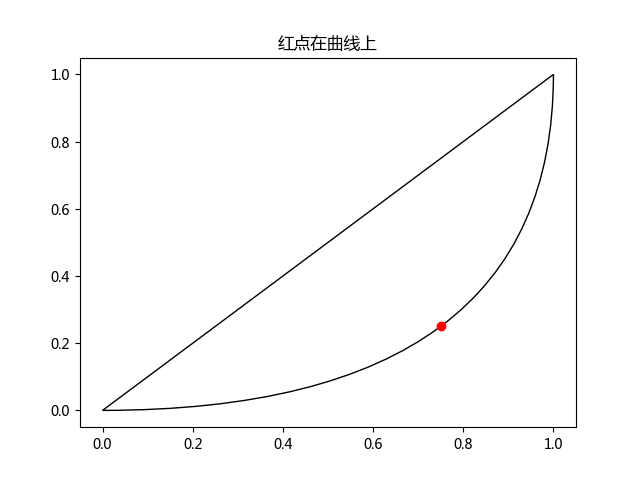
Path.MOVETO可以理解为把画笔移动到(0,0)点,第一个Path.CURVE3表示设置控制点为(1,0),起始点默认为前一个点,第二个Path.CURVE3表示设置二次赛贝尔曲线的终点为(1,1),Path.CLOSEPOLY表示画从起点到最后一个点的直线封闭图形(设置了CLOSEPOLY图形可能也不是封闭的)
组合路径实例
#-*-coding:utf-8-*-
import numpy as np
from matplotlib.path import Path
from matplotlib.patches import PathPatch
import matplotlib.pyplot as plt


vertices = []
codes = []

codes = [Path.MOVETO] + [Path.LINETO]*3 + [Path.CLOSEPOLY]
vertices = [(1, 1), (1, 2), (2, 2), (2, 1), (0, 0)]

codes += [Path.MOVETO] + [Path.LINETO]*2 + [Path.CLOSEPOLY]
vertices += [(4, 4), (5, 5), (5, 4), (0, 0)]

vertices = np.array(vertices, float)
path = Path(vertices, codes)

pathpatch = PathPatch(path, facecolor='None', edgecolor='green')

fig, ax = plt.subplots()
ax.add_patch(pathpatch)
ax.set_title(u'组合路径实例')

ax.dataLim.update_from_data_xy(vertices)
ax.autoscale_view()

plt.savefig("conpund.png")
plt.show()
上面也是官网的一个实例,画出来的画风大概是下面这样的:
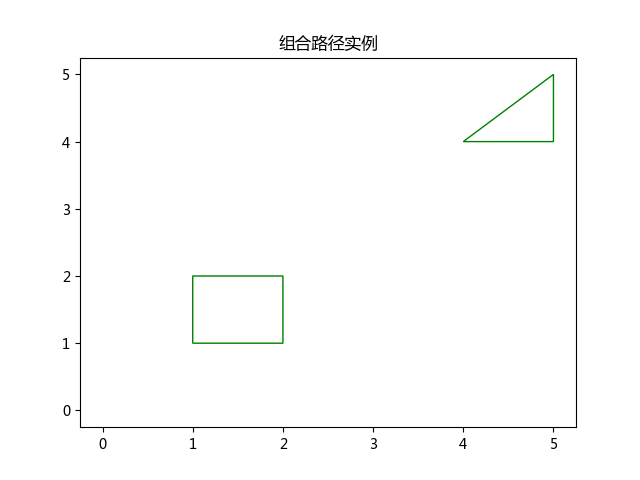
我们来看一下第一个矩形就可以了,Path.MOVETO一般是起点用,可以理解为吧画笔移动到(1,1),第一个Path.LINETO就是从前一个点画一个到(1,2)点的直线,其他的同理,注意这里的Path.CLOSEPOLY设置的(0,0)点并不是终点坐标,我们可以很清楚的看到最后一个点的坐标是(2,1),所以,我们设置Path.CLOSEPOLY也可以使用这种直接设置为(0,0)就可以了。
三次赛贝尔曲线实例
#-*-coding:utf-8-*-
import matplotlib.path as mpath
import matplotlib.patches as mpatches
import matplotlib.pyplot as plt

fig, ax = plt.subplots()

Path = mpath.Path
path_data = [
    (Path.MOVETO, (1.58, -2.57)),
    (Path.CURVE4, (0.35, -1.1)),
    (Path.CURVE4, (-1.75, 2.0)),
    (Path.CURVE4, (0.375, 2.0)),
    (Path.LINETO, (0.85, 1.15)),
    (Path.CURVE4, (2.2, 3.2)),
    (Path.CURVE4, (3, 0.05)),
    (Path.CURVE4, (2.0, -0.5)),
    (Path.CLOSEPOLY, (1.58, -2.57)),
    ]
codes, verts = zip(*path_data)
path = mpath.Path(verts, codes)
patch = mpatches.PathPatch(path, facecolor='r', alpha=0.5)
ax.add_patch(patch)

x, y = zip(*path.vertices)
line, = ax.plot(x, y, 'go-')

ax.grid()
ax.axis('equal')
plt.savefig("heart.png")
plt.show()
这个也是官网的一个实例,画出来的画风大概是下面这样的:
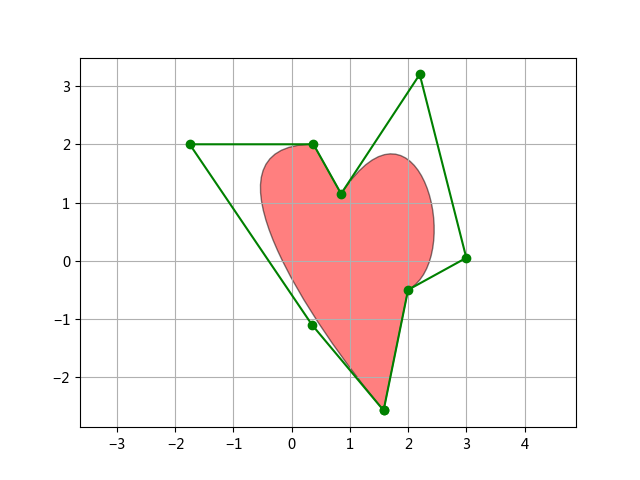
Path.MOVETO已经轻车熟路了,画笔移动到(1.58, -2.57),前2个Path.CURVE4表示三次赛贝尔曲线的控制点,第三个Path.CURVE4表示赛贝尔曲线的终点。起点是前一个点。所以可以看到出现Path.CURVE4个数都是3的倍数出现的。
Path的一些类方法实例
#-*-coding:utf-8-*-
import matplotlib.path as mpath
import matplotlib.patches as mpatches
import matplotlib.pyplot as plt
import matplotlib

Path = mpath.Path

ax = plt.subplot(331)
ax.axis([-5,5,-5,5])
ax.set_title('unit_regular_star')
cp = matplotlib.path.Path.unit_regular_star(5, innerCircle=0.5)
path = mpatches.PathPatch(cp)
ax.add_patch(path)

ax = plt.subplot(332)
ax.axis([-5,5,-5,5])
ax.set_title('circle')
cp = matplotlib.path.Path.circle((0,0),2)
path = mpatches.PathPatch(cp)
ax.add_patch(path)

ax = plt.subplot(333)
ax.axis([-5,5,-5,5])
ax.set_title('arc(90,180)')
cp = matplotlib.path.Path.arc(90,180)
path = mpatches.PathPatch(cp)
ax.add_patch(path)

ax = plt.subplot(334)
ax.axis([-5,5,-5,5])
ax.set_title('wedge(90,180)')
cp = matplotlib.path.Path.wedge(90,180)
path = mpatches.PathPatch(cp)
ax.add_patch(path)


ax = plt.subplot(335)
ax.axis([-5,5,-5,5])
ax.set_title('unit_circle_righthalf')
cp = matplotlib.path.Path.unit_circle_righthalf()
path = mpatches.PathPatch(cp)
ax.add_patch(path)

ax = plt.subplot(336)
ax.axis([-5,5,-5,5])
ax.set_title('unit_rectangle')
cp = matplotlib.path.Path.unit_rectangle()
path = mpatches.PathPatch(cp)
ax.add_patch(path)

ax = plt.subplot(337)
ax.axis([-5,5,-5,5])
ax.set_title('unit_regular_asterisk(5)')
cp = matplotlib.path.Path.unit_regular_asterisk(5)
path = mpatches.PathPatch(cp)
ax.add_patch(path)

ax = plt.subplot(338)
ax.axis([-5,5,-5,5])
ax.set_title('unit_regular_polygon(6)')
cp = matplotlib.path.Path.unit_regular_polygon(6)
path = mpatches.PathPatch(cp)
ax.add_patch(path)


# codes = [Path.MOVETO] + [Path.LINETO]*3 + [Path.CLOSEPOLY]
# vertices = [(1, 1), (1, 2), (2, 2), (2, 1), (0, 0)]
# bpath = Path(vertices, codes)
pb = matplotlib.transforms.Bbox([[-1,-1],[1,1]])

tcodes = [Path.MOVETO] + [Path.LINETO]*2 + [Path.CLOSEPOLY]
tvertices = [(-4, -4), (4, -4), (0, 4), (0, 0)]

tpath = Path(tvertices, tcodes)
tpath = tpath.clip_to_bbox(pb, inside=True)
# tpath = tpath.clip_to_bbox(pb, inside=False)
cp = mpatches.PathPatch(tpath)

ax = plt.subplot(339)
ax.axis([-5,5,-5,5])
ax.set_title('clip_to_bbox')
ax.add_patch(cp)

plt.gcf().set_size_inches(12,10)
plt.savefig("method.png")
plt.show()
注意最后一个不是类方法,而是实例方法。
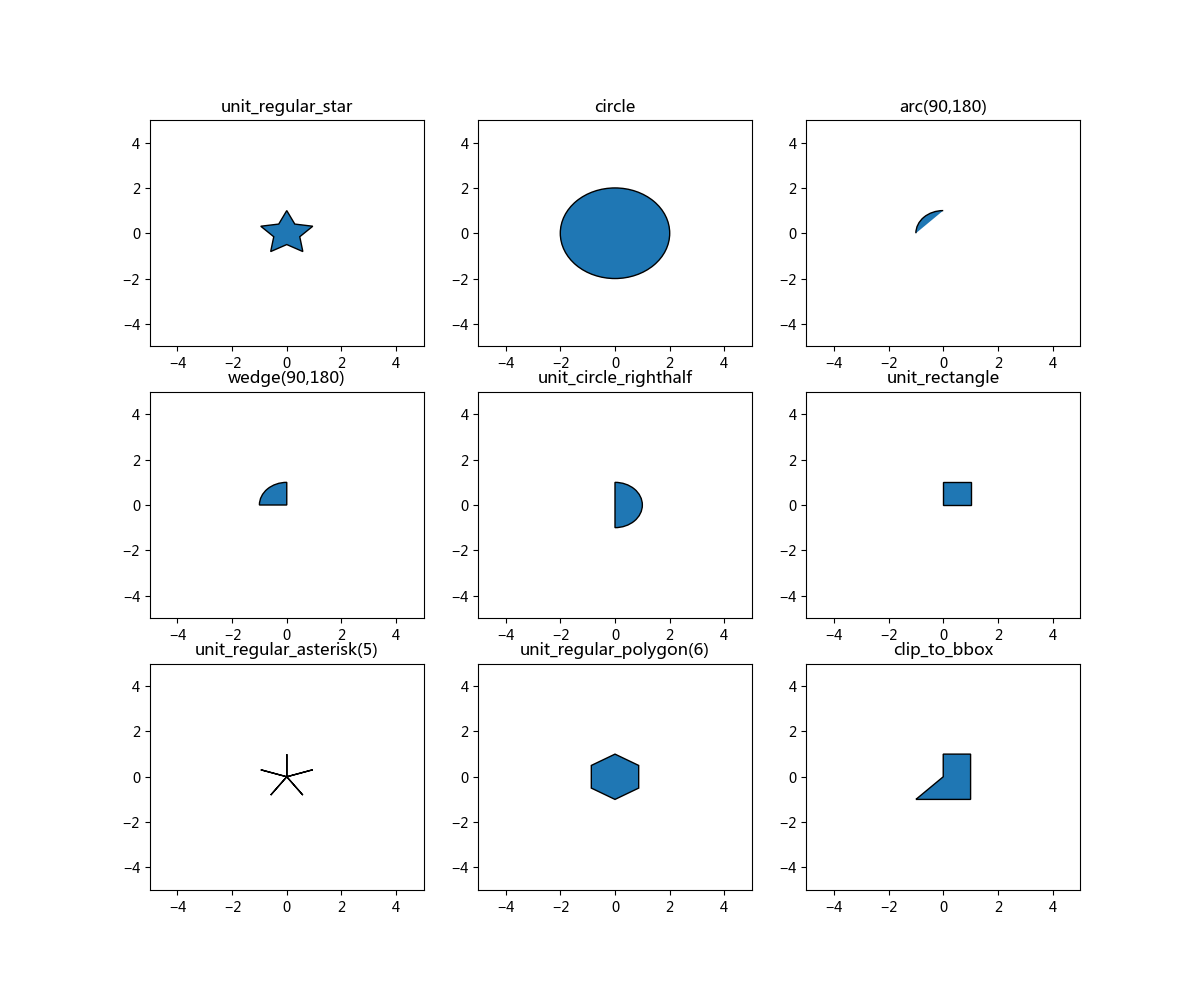
Path复杂图形
下面来2个官网实例中比较复杂的图形,看一下matplotlib的强大
Path复杂图形之Firefox
#-*-coding:utf-8-*-
import re
import numpy as np
import matplotlib.pyplot as plt
from matplotlib.path import Path
import matplotlib.patches as patches

# From: http://raphaeljs.com/icons/#firefox
firefox = "M28.4,22.469c0.479-0.964,0.851-1.991,1.095-3.066c0.953-3.661,0.666-6.854,0.666-6.854l-0.327,2.104c0,0-0.469-3.896-1.044-5.353c-0.881-2.231-1.273-2.214-1.274-2.21c0.542,1.379,0.494,2.169,0.483,2.288c-0.01-0.016-0.019-0.032-0.027-0.047c-0.131-0.324-0.797-1.819-2.225-2.878c-2.502-2.481-5.943-4.014-9.745-4.015c-4.056,0-7.705,1.745-10.238,4.525C5.444,6.5,5.183,5.938,5.159,5.317c0,0-0.002,0.002-0.006,0.005c0-0.011-0.003-0.021-0.003-0.031c0,0-1.61,1.247-1.436,4.612c-0.299,0.574-0.56,1.172-0.777,1.791c-0.375,0.817-0.75,2.004-1.059,3.746c0,0,0.133-0.422,0.399-0.988c-0.064,0.482-0.103,0.971-0.116,1.467c-0.09,0.845-0.118,1.865-0.039,3.088c0,0,0.032-0.406,0.136-1.021c0.834,6.854,6.667,12.165,13.743,12.165l0,0c1.86,0,3.636-0.37,5.256-1.036C24.938,27.771,27.116,25.196,28.4,22.469zM16.002,3.356c2.446,0,4.73,0.68,6.68,1.86c-2.274-0.528-3.433-0.261-3.423-0.248c0.013,0.015,3.384,0.589,3.981,1.411c0,0-1.431,0-2.856,0.41c-0.065,0.019,5.242,0.663,6.327,5.966c0,0-0.582-1.213-1.301-1.42c0.473,1.439,0.351,4.17-0.1,5.528c-0.058,0.174-0.118-0.755-1.004-1.155c0.284,2.037-0.018,5.268-1.432,6.158c-0.109,0.07,0.887-3.189,0.201-1.93c-4.093,6.276-8.959,2.539-10.934,1.208c1.585,0.388,3.267,0.108,4.242-0.559c0.982-0.672,1.564-1.162,2.087-1.047c0.522,0.117,0.87-0.407,0.464-0.872c-0.405-0.466-1.392-1.105-2.725-0.757c-0.94,0.247-2.107,1.287-3.886,0.233c-1.518-0.899-1.507-1.63-1.507-2.095c0-0.366,0.257-0.88,0.734-1.028c0.58,0.062,1.044,0.214,1.537,0.466c0.005-0.135,0.006-0.315-0.001-0.519c0.039-0.077,0.015-0.311-0.047-0.596c-0.036-0.287-0.097-0.582-0.19-0.851c0.01-0.002,0.017-0.007,0.021-0.021c0.076-0.344,2.147-1.544,2.299-1.659c0.153-0.114,0.55-0.378,0.506-1.183c-0.015-0.265-0.058-0.294-2.232-0.286c-0.917,0.003-1.425-0.894-1.589-1.245c0.222-1.231,0.863-2.11,1.919-2.704c0.02-0.011,0.015-0.021-0.008-0.027c0.219-0.127-2.524-0.006-3.76,1.604C9.674,8.045,9.219,7.95,8.71,7.95c-0.638,0-1.139,0.07-1.603,0.187c-0.05,0.013-0.122,0.011-0.208-0.001C6.769,8.04,6.575,7.88,6.365,7.672c0.161-0.18,0.324-0.356,0.495-0.526C9.201,4.804,12.43,3.357,16.002,3.356z"


def svg_parse(path):
    commands = {'M': (Path.MOVETO,),
                'L': (Path.LINETO,),
                'Q': (Path.CURVE3,)*2,
                'C': (Path.CURVE4,)*3,
                'Z': (Path.CLOSEPOLY,)}
    path_re = re.compile(r'([MLHVCSQTAZ])([^MLHVCSQTAZ]+)', re.IGNORECASE)
    float_re = re.compile(r'(?:[\s,]*)([+-]?\d+(?:\.\d+)?)')
    vertices = []
    codes = []
    last = (0, 0)
    for cmd, values in path_re.findall(path):
        points = [float(v) for v in float_re.findall(values)]
        points = np.array(points).reshape((len(points)//2, 2))
        if cmd.islower():
            points += last
        cmd = cmd.capitalize()
        last = points[-1]
        codes.extend(commands[cmd])
        vertices.extend(points.tolist())
    return codes, vertices

# SVG to matplotlib
codes, verts = svg_parse(firefox)
verts = np.array(verts)
path = Path(verts, codes)

# Make upside down
verts[:, 1] *= -1
xmin, xmax = verts[:, 0].min()-1, verts[:, 0].max()+1
ymin, ymax = verts[:, 1].min()-1, verts[:, 1].max()+1

fig = plt.figure(figsize=(5, 5))
ax = fig.add_axes([0.0, 0.0, 1.0, 1.0], frameon=False, aspect=1)

# White outline (width = 6)
patch = patches.PathPatch(path, facecolor='None', edgecolor='w', lw=6)
ax.add_patch(patch)

# Actual shape with black outline
patch = patches.PathPatch(path, facecolor='orange', edgecolor='k', lw=2)
ax.add_patch(patch)

# Centering
ax.set_xlim(xmin, xmax)
ax.set_ylim(ymin, ymax)

# No ticks
ax.set_xticks([])
ax.set_yticks([])

# Display
plt.savefig("firefox.png")
plt.show()

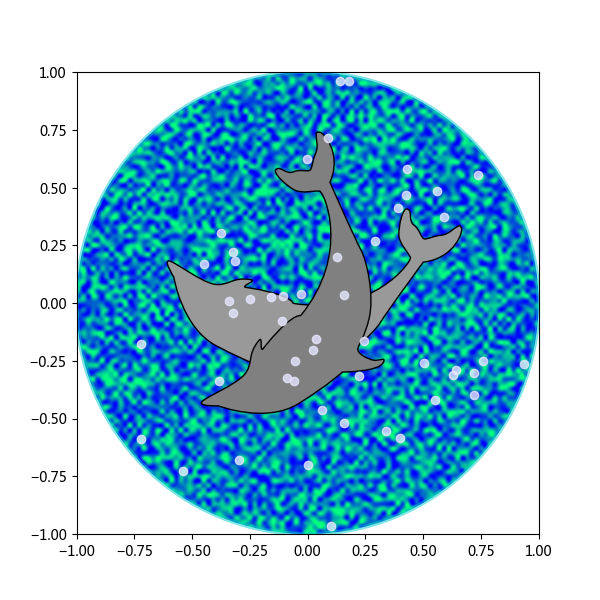
Path复杂图形之dolphin
#-*-coding:utf-8-*-
import matplotlib.cm as cm
import matplotlib.pyplot as plt
from matplotlib.patches import Circle, PathPatch
from matplotlib.path import Path
from matplotlib.transforms import Affine2D
import numpy as np

# Fixing random state for reproducibility
np.random.seed(19680801)


r = np.random.rand(50)
t = np.random.rand(50) * np.pi * 2.0
x = r * np.cos(t)
y = r * np.sin(t)

fig, ax = plt.subplots(figsize=(6, 6))
circle = Circle((0, 0), 1, facecolor='none',
                edgecolor=(0, 0.8, 0.8), linewidth=3, alpha=0.5)
ax.add_patch(circle)

im = plt.imshow(np.random.random((100, 100)),
                origin='lower', cmap=cm.winter,
                interpolation='spline36',
                extent=([-1, 1, -1, 1]))
im.set_clip_path(circle)

plt.plot(x, y, 'o', color=(0.9, 0.9, 1.0), alpha=0.8)

# Dolphin from OpenClipart library by Andy Fitzsimon
#       <cc:License rdf:about="http://web.resource.org/cc/PublicDomain">
#         <cc:permits rdf:resource="http://web.resource.org/cc/Reproduction"/>
#         <cc:permits rdf:resource="http://web.resource.org/cc/Distribution"/>
#         <cc:permits rdf:resource="http://web.resource.org/cc/DerivativeWorks"/>
#       </cc:License>

dolphin = """
M -0.59739425,160.18173 C -0.62740401,160.18885 -0.57867129,160.11183
-0.57867129,160.11183 C -0.57867129,160.11183 -0.5438361,159.89315
-0.39514638,159.81496 C -0.24645668,159.73678 -0.18316813,159.71981
-0.18316813,159.71981 C -0.18316813,159.71981 -0.10322971,159.58124
-0.057804323,159.58725 C -0.029723983,159.58913 -0.061841603,159.60356
-0.071265813,159.62815 C -0.080250183,159.65325 -0.082918513,159.70554
-0.061841203,159.71248 C -0.040763903,159.7194 -0.0066711426,159.71091
0.077336307,159.73612 C 0.16879567,159.76377 0.28380306,159.86448
0.31516668,159.91533 C 0.3465303,159.96618 0.5011127,160.1771
0.5011127,160.1771 C 0.63668998,160.19238 0.67763022,160.31259
0.66556395,160.32668 C 0.65339985,160.34212 0.66350443,160.33642
0.64907098,160.33088 C 0.63463742,160.32533 0.61309688,160.297
0.5789627,160.29339 C 0.54348657,160.28968 0.52329693,160.27674
0.50728856,160.27737 C 0.49060916,160.27795 0.48965803,160.31565
0.46114204,160.33673 C 0.43329696,160.35786 0.4570711,160.39871
0.43309565,160.40685 C 0.4105108,160.41442 0.39416631,160.33027
0.3954995,160.2935 C 0.39683269,160.25672 0.43807996,160.21522
0.44567915,160.19734 C 0.45327833,160.17946 0.27946869,159.9424
-0.061852613,159.99845 C -0.083965233,160.0427 -0.26176109,160.06683
-0.26176109,160.06683 C -0.30127962,160.07028 -0.21167141,160.09731
-0.24649368,160.1011 C -0.32642366,160.11569 -0.34521187,160.06895
-0.40622293,160.0819 C -0.467234,160.09485 -0.56738444,160.17461
-0.59739425,160.18173
"""

vertices = []
codes = []
parts = dolphin.split()
i = 0
code_map = {
    'M': (Path.MOVETO, 1),
    'C': (Path.CURVE4, 3),
    'L': (Path.LINETO, 1)}

while i < len(parts):
    code = parts[i]
    path_code, npoints = code_map[code]
    codes.extend([path_code] * npoints)
    vertices.extend([[float(x) for x in y.split(',')] for y in
                     parts[i + 1:i + npoints + 1]])
    i += npoints + 1
vertices = np.array(vertices, float)
vertices[:, 1] -= 160

dolphin_path = Path(vertices, codes)
dolphin_patch = PathPatch(dolphin_path, facecolor=(0.6, 0.6, 0.6),
                          edgecolor=(0.0, 0.0, 0.0))
ax.add_patch(dolphin_patch)

vertices = Affine2D().rotate_deg(60).transform(vertices)
dolphin_path2 = Path(vertices, codes)
dolphin_patch2 = PathPatch(dolphin_path2, facecolor=(0.5, 0.5, 0.5),
                           edgecolor=(0.0, 0.0, 0.0))
ax.add_patch(dolphin_patch2)

plt.savefig("dolphin.png")
plt.show()
