import matplotlib.pyplot as plt
from matplotlib.path import Path
import matplotlib.patches as patches
Path 通过一个(N, 2)的包含(x, y)的点来实例比如,我们想要画一个标准的正方形:
verts = [
   (0., 0.),  # left, bottom
   (0., 1.),  # left, top
   (1., 1.),  # right, top
   (1., 0.),  # right, bottom
   (0., 0.),  # ignored
]

codes = [
    Path.MOVETO,
    Path.LINETO,
    Path.LINETO,
    Path.LINETO,
    Path.LINETO,
]

path = Path(verts, codes)

fig, ax = plt.subplots(figsize=(5, 5))
patch = patches.PathPatch(path, facecolor='orange', lw=2)
ax.add_patch(patch)
ax.set_xlim(-2, 2)
ax.set_ylim(-2, 2)
plt.show()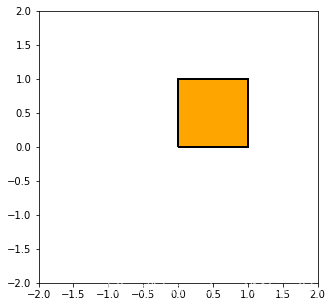
注意到,上面的codes包含了一些path的种类:
STOP: 标志着整个path的结束
MOVETO: 提起笔,移动到当前给定的位置 path的第一个点必须是MOVETO 表示提起笔?
LINETO: 画一条从当前位置到给定点的直线
CURVE3: 需要给定一个控制点和一个结束点 画一个二次Bézier曲线,利用控制点到结束点
CURVE4: 需要给定俩个控制点和一个街书店, 画一个三次Beier曲线, 利用给定的控制点到结束点
Bezier example
有些path需要多个点来确定,比如上面的CURVE3要2个点CURVE4需要3个点
verts = [
   (0., 0.),   # P0
   (0.2, 1.),  # P1
   (1., 0.8),  # P2
   (0.8, 0.),  # P3
]

codes = [
    Path.MOVETO,
    Path.CURVE4, #我们看到CURVE4占了3个点
    Path.CURVE4,
    Path.CURVE4,
]

path = Path(verts, codes)

fig, ax = plt.subplots()
patch = patches.PathPatch(path, facecolor='none', lw=2)
ax.add_patch(patch)

xs, ys = zip(*verts)
ax.plot(xs, ys, 'x--', lw=2, color='black', ms=10)

ax.text(-0.05, -0.05, 'P0')
ax.text(0.15, 1.05, 'P1')
ax.text(1.05, 0.85, 'P2')
ax.text(0.85, -0.05, 'P3')

ax.set_xlim(-0.1, 1.1)
ax.set_ylim(-0.1, 1.1)
plt.show()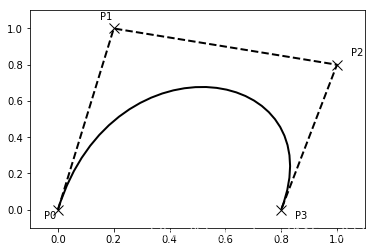
扫描二维码关注公众号,回复:
6303986 查看本文章

用path来画柱状图
matplotlib里面的很多元素,比如hist, bar等都是以path为图元的
import numpy as np
nrects = 100
data = np.random.randn(1000)
n, bins = np.histogram(data, nrects) # n每个bin的个数, bins位置
left = np.array(bins[:-1]) #矩形的左边位置
right = np.array(bins[1:]) #矩形的右边位置
bottom = np.zeros(nrects) #下
top = bottom + n #上接下来,我们来构建柱状体,每个柱子需要5个点,一个MOVETO,三个LINETO,一个CLOSEPOLY
nverts = nrects*(1+3+1)
verts = np.zeros((nverts, 2)) #构建nevrts * 2 的数组
codes = np.ones(nverts, int) * Path.LINETO #LINETO == 2
codes[0::5] = Path.MOVETO #每隔五步是一个新的起点 MOVETO == 1
codes[4::5] = Path.CLOSEPOLY  #同样有一个终点 CLOSEPOLY == 79
verts[0::5,0] = left #下面都是设置起始位置
verts[0::5,1] = bottom
verts[1::5,0] = left
verts[1::5,1] = top
verts[2::5,0] = right
verts[2::5,1] = top
verts[3::5,0] = right
verts[3::5,1] = bottom
barpath = Path(verts, codes)
patch = patches.PathPatch(barpath, facecolor='green',
edgecolor='yellow', alpha=0.5)
fig, ax = plt.subplots()
ax.add_patch(patch)
ax.set_xlim(left[0], right[-1]) #坐标不会自动调整,需要自己设定
ax.set_ylim(bottom.min(), top.max())
plt.show()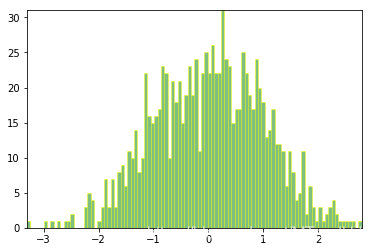
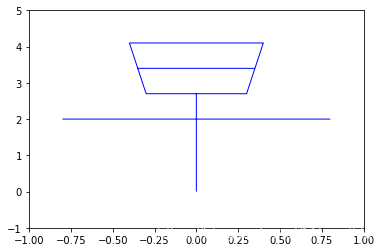
随便玩玩
verts = [
    (1, 0),
    (0, 1),
    (2, 2),
    (3, 3.5),
    (4, 3.2),
    (3.6, 0)
]
codes = [
    Path.MOVETO,
    Path.CURVE3,
    Path.CURVE3,
    Path.CURVE4,
    Path.CURVE4,
    Path.CURVE4
]
linepath = Path(verts, codes)
pathce = patches.PathPatch(linepath, facecolor="yellow", edgecolor="red")
fig, ax  = plt.subplots()
ax.add_patch(pathce)
ax.set_xlim(0, 5)
ax.set_ylim(0, 4)
plt.show()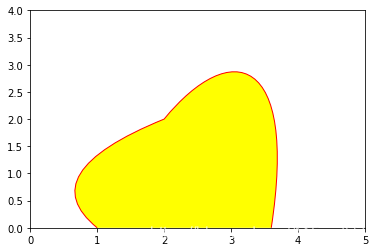
verts = [
    (0, 0),
    (0, 2.7),
    (-0.8, 2),
    (0.8, 2),
    (-0.3, 2.7),
    (0.3, 2.7),
    (-0.4, 4.1),
    (0.4, 4.1),
    (-0.35, 3.4),
    (0.35, 3.4),
    (-0.3, 2.7),
    (-0.4, 4.1),
    (0.3, 2.7),
    (0.4, 4.1)
]
codes = [
    Path.MOVETO,
    Path.LINETO,
    Path.MOVETO,
    Path.LINETO,
    Path.MOVETO,
    Path.LINETO,
    Path.MOVETO,
    Path.LINETO,
    Path.MOVETO,
    Path.LINETO,
    Path.MOVETO,
    Path.LINETO,
    Path.MOVETO,
    Path.LINETO
]
zaopath = Path(verts, codes)
patch = patches.PathPatch(zaopath, edgecolor="blue")
fig, ax = plt.subplots()
ax.add_patch(patch)
ax.set_xlim(-1, 1)
ax.set_ylim(-1, 5)
plt.show()