目录
我们可以通过path来修饰Artist, 通过set_path_effects
import matplotlib.pyplot as plt
import matplotlib.patheffects as path_effects

fig = plt.figure(figsize=(5, 1.5))
ax = fig.add_axes([0, 0, 1, 1])
ax.set_visible(False)
text = fig.text(0.5, 0.5, 'Hello path effects world!\nThis is the normal '
                          'path effect.\nPretty dull, huh?',
                ha='center', va='center', size=20)
text.set_path_effects([path_effects.Normal()])
plt.show()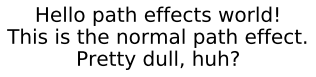
添加阴影
比之Normal更加有意思的是添加阴影
import matplotlib.patheffects as path_effects

text = plt.text(0.5, 0.5, 'Hello path effects world!',
                path_effects=[path_effects.withSimplePatchShadow()])

plt.plot([0, 3, 2, 5], linewidth=5, color='blue',
         path_effects=[path_effects.SimpleLineShadow(),
                       path_effects.Normal()])
plt.show()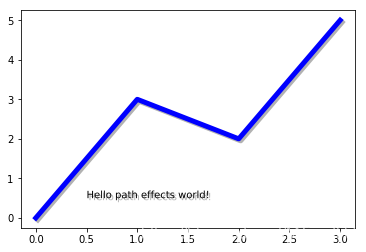
注意到,上面的例子中,我们用path_effects属性,分别为text和line2D添加了阴影
使Artist变得突出
想要完成这一步不敌,利用stroke是不错的选择,虽然我不知道这是什么东西
fig = plt.figure(figsize=(7, 1))
ax = fig.add_axes([0, 0, 1, 1])
ax.set_visible(False)
text = fig.text(0.5, 0.5, 'This text stands out because of\n'
                          'its black border.', color='white',
                          ha='center', va='center', size=30)
text.set_path_effects([path_effects.Stroke(linewidth=3, foreground='black'),
                       path_effects.Normal()])
plt.show()
更多效果
fig = plt.figure(figsize=(8, 1))
ax = fig.add_axes([0, 0, 1, 1])
ax.set_visible(False)
t = fig.text(0.02, 0.5, 'Hatch shadow', fontsize=75, weight=1000, va='center')
t.set_path_effects([path_effects.PathPatchEffect(offset=(4, -4), hatch='xxxx',
                                                 facecolor='gray'),
                    path_effects.PathPatchEffect(edgecolor='white', linewidth=1.1,
                                                 facecolor='black')])
plt.show()