1. ELK收集Nginx普通格式的日志
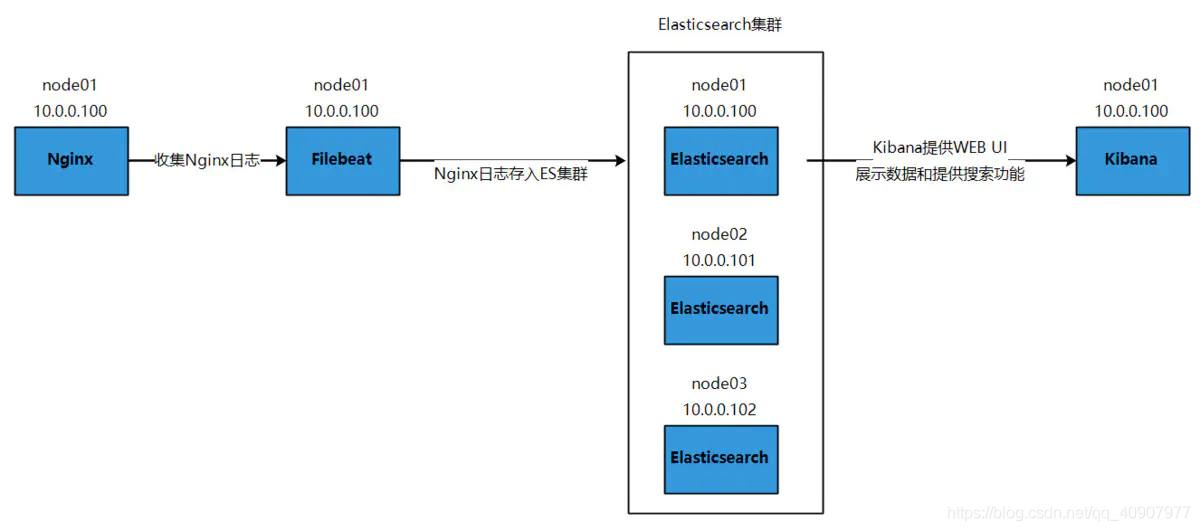
1.1 测试服务器架构
1.2 ab工具使用
yum install httpd-tools -y

# -n 总共发送多少条请求,注意,最后"/"一定要写,否则命令无法执行
# -c 多少条请求发送一次
ab -c 10 -n 100 http://10.0.0.100:80/

[root@node01 log]# tail -f /var/log/nginx/access.log
10.0.0.100 - - [16/Apr/2020:19:03:40 +0800] "GET / HTTP/1.0" 200 612 "-" "ApacheBench/2.3" "-"
10.0.0.100 - - [16/Apr/2020:19:03:40 +0800] "GET / HTTP/1.0" 200 612 "-" "ApacheBench/2.3" "-"
10.0.0.100 - - [16/Apr/2020:19:03:40 +0800] "GET / HTTP/1.0" 200 612 "-" "ApacheBench/2.3" "-"
10.0.0.100 - - [16/Apr/2020:19:03:40 +0800] "GET / HTTP/1.0" 200 612 "-" "ApacheBench/2.3" "-"
10.0.0.100 - - [16/Apr/2020:19:03:40 +0800] "GET / HTTP/1.0" 200 612 "-" "ApacheBench/2.3" "-"
10.0.0.100 - - [16/Apr/2020:19:03:40 +0800] "GET / HTTP/1.0" 200 612 "-" "ApacheBench/2.3" "-"
10.0.0.100 - - [16/Apr/2020:19:03:40 +0800] "GET / HTTP/1.0" 200 612 "-" "ApacheBench/2.3" "-"
10.0.0.100 - - [16/Apr/2020:19:03:40 +0800] "GET / HTTP/1.0" 200 612 "-" "ApacheBench/2.3" "-"
10.0.0.100 - - [16/Apr/2020:19:03:40 +0800] "GET / HTTP/1.0" 200 612 "-" "ApacheBench/2.3" "-"
10.0.0.100 - - [16/Apr/2020:19:03:40 +0800] "GET / HTTP/1.0" 200 612 "-" "ApacheBench/2.3" "-"
ab工具用于批量发送HTTP请求到指定的URL,是一个压力测试工具,这里使用它来生成Nginx的日志
1.3 filebeat配置
- 配置文件:/etc/filebeat/filebeat.yml
# 我们只留下最精简的部分
# 定义数据源
filebeat.inputs:
# 数据源为普通日志文件
- type: log
  # 启用
  enabled: true
  # 日志文件的位置
  paths:
    - /var/log/nginx/access.log

# 定义输出类型
# 输出到elasitcsearch
output.elasticsearch:
  hosts: ["10.0.0.100:9200","10.0.0.101:9200","10.0.0.102:9200"]
- 启动filebeat:systemctl start filebeat
- 查看ES的index
GET _cat/indices

green open filebeat-6.6.0-2020.04.16 Y9pmNuEoTW2lGdxq40wsqg 3 1 100 0 225.1kb 106.3kb

GET filebeat-6.6.0-2020.04.16/_search

{
  "took" : 6,
  "timed_out" : false,
  "_shards" : {
    "total" : 3,
    "successful" : 3,
    "skipped" : 0,
    "failed" : 0
  },
  "hits" : {
    "total" : 100,
    "max_score" : 1.0,
    "hits" : [
      {
        "_index" : "filebeat-6.6.0-2020.04.15",
        "_type" : "doc",
        "_id" : "9GaVfXEBcWrWjTbD1Bo0",
        "_score" : 1.0,
        "_source" : {
          "@timestamp" : "2020-04-16T11:25:01.369Z",
          "beat" : {
            "version" : "6.6.0",
            "name" : "node01",
            "hostname" : "node01"
          },
          "host" : {
            "name" : "node01",
            "architecture" : "x86_64",
            "os" : {
              "family" : "redhat",
              "name" : "CentOS Linux",
              "codename" : "Core",
              "platform" : "centos",
              "version" : "7 (Core)"
            },
            "id" : "ea70b3ad93714ed2be82e374ec284fe6",
            "containerized" : true
          },
          "log" : {
            "file" : {
              "path" : "/var/log/nginx/access.log"
            }
          },
          # Nginx日志
          "message" : """10.0.0.100 - - [16/Apr/2020:19:03:40 +0800] "GET / HTTP/1.0" 200 612 "-" "ApacheBench/2.3" "-"""",
          "source" : "/var/log/nginx/access.log",
          "offset" : 4940,
          "prospector" : {
            "type" : "log"
          },
          "input" : {
            "type" : "log"
          }
        }
      }
      ......
    ]
  }
}
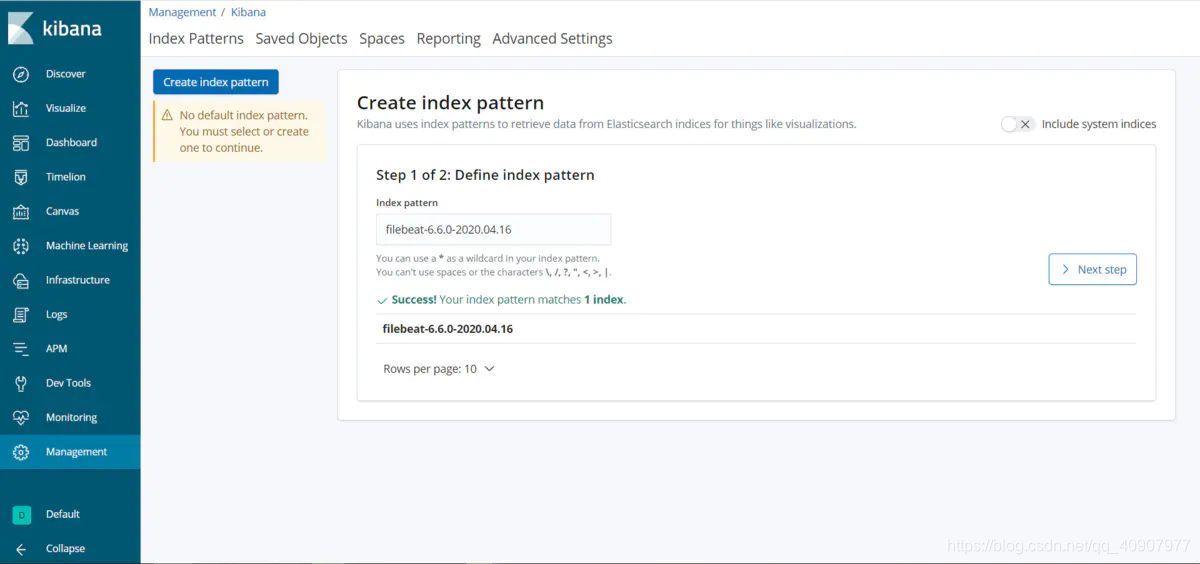
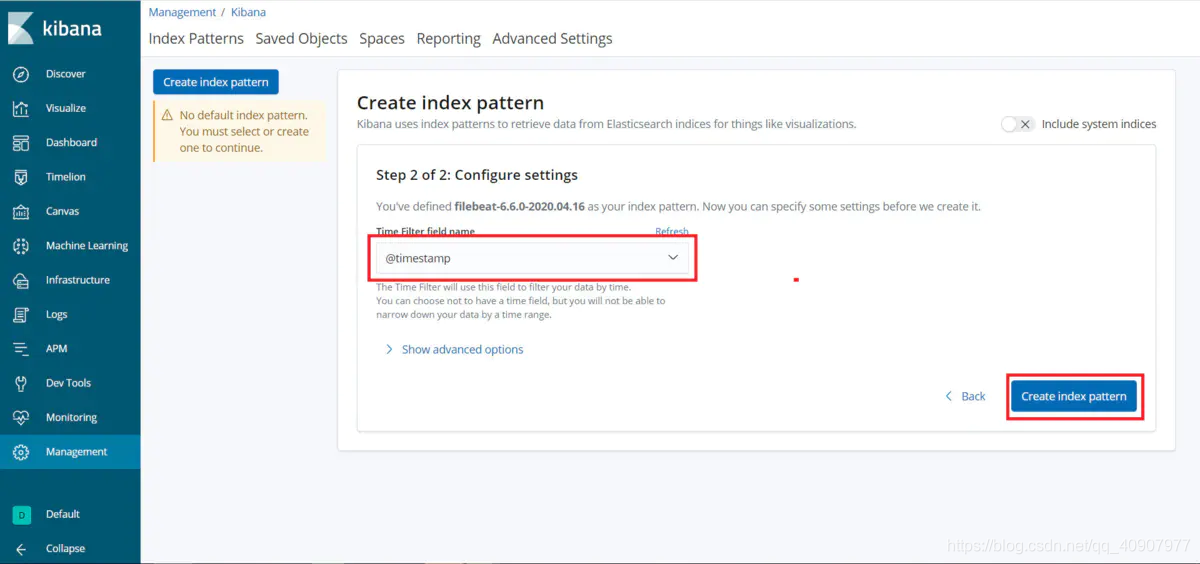
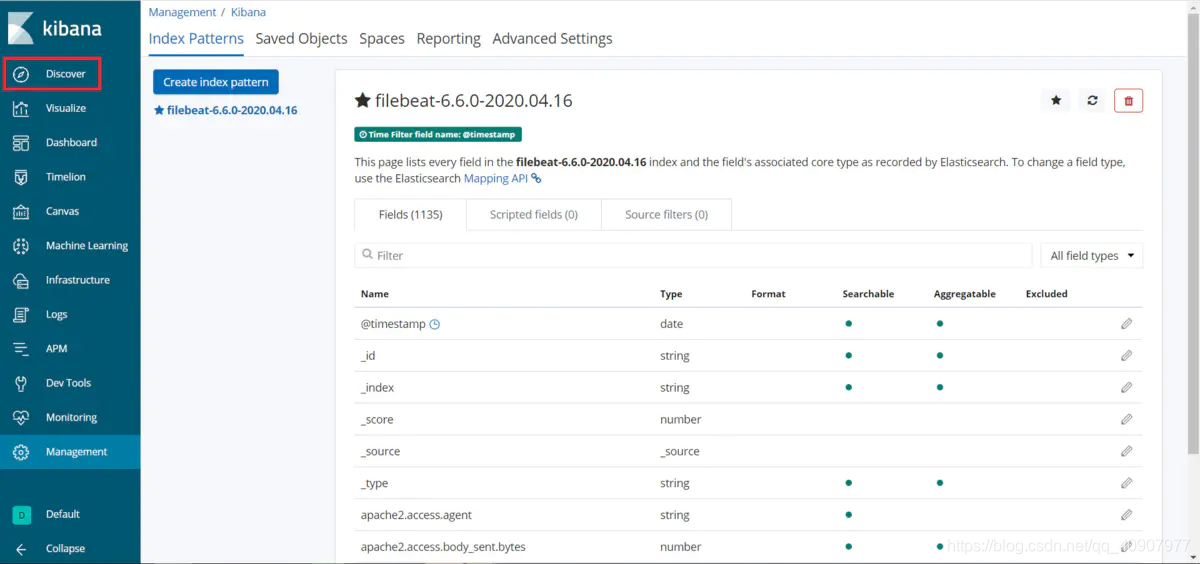
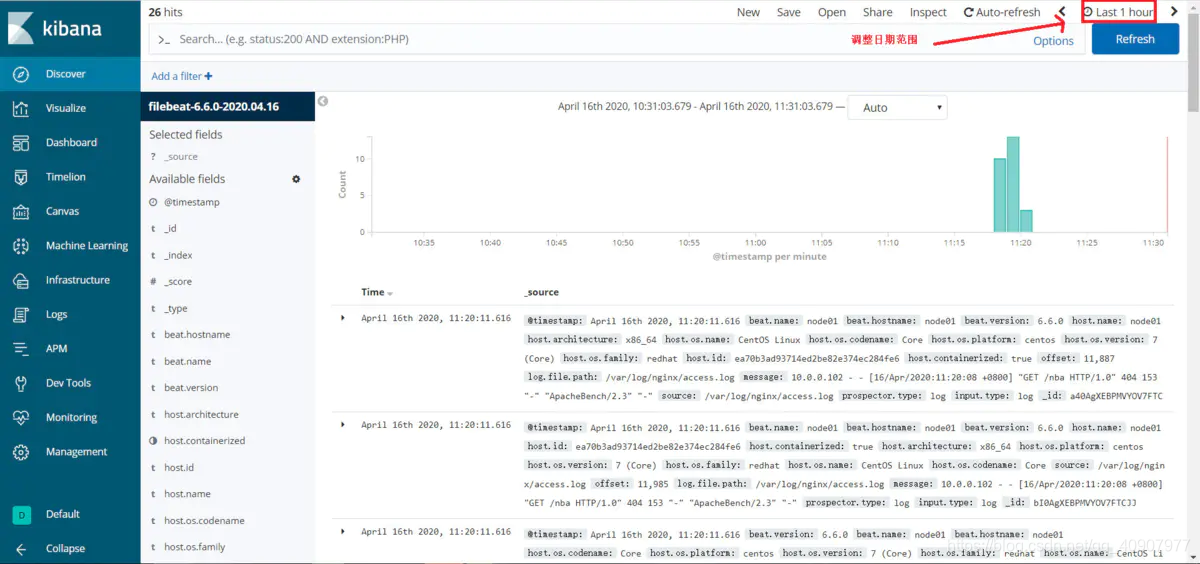
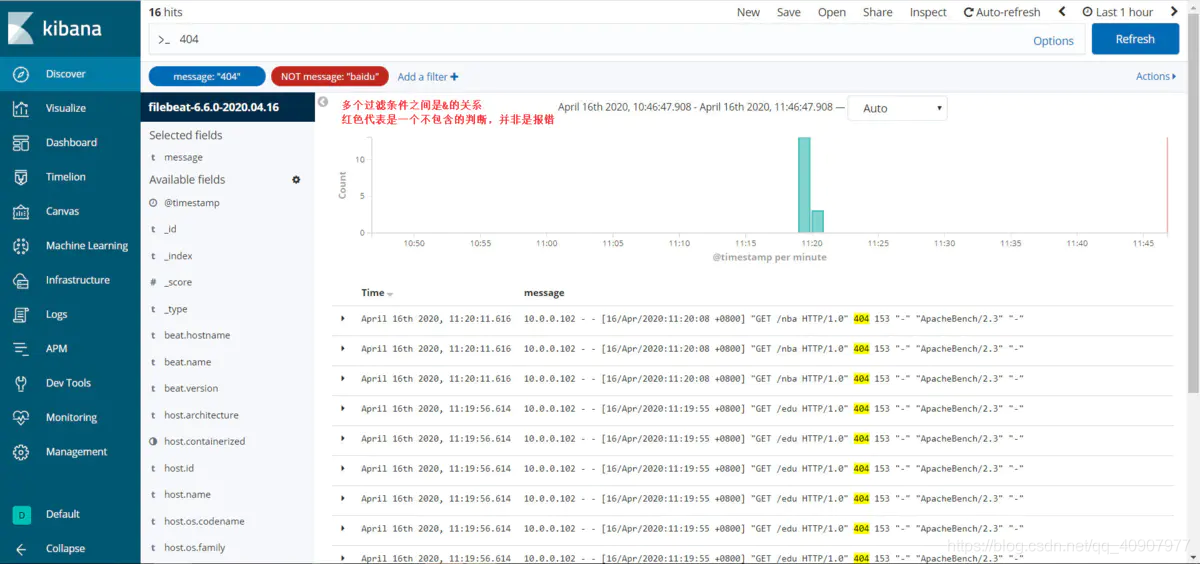
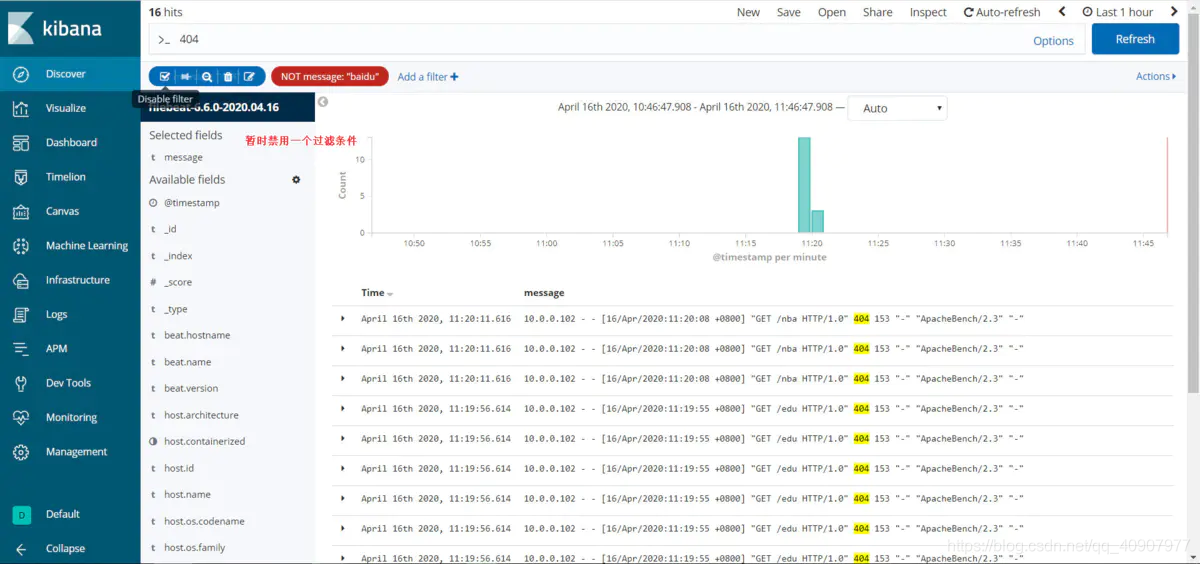
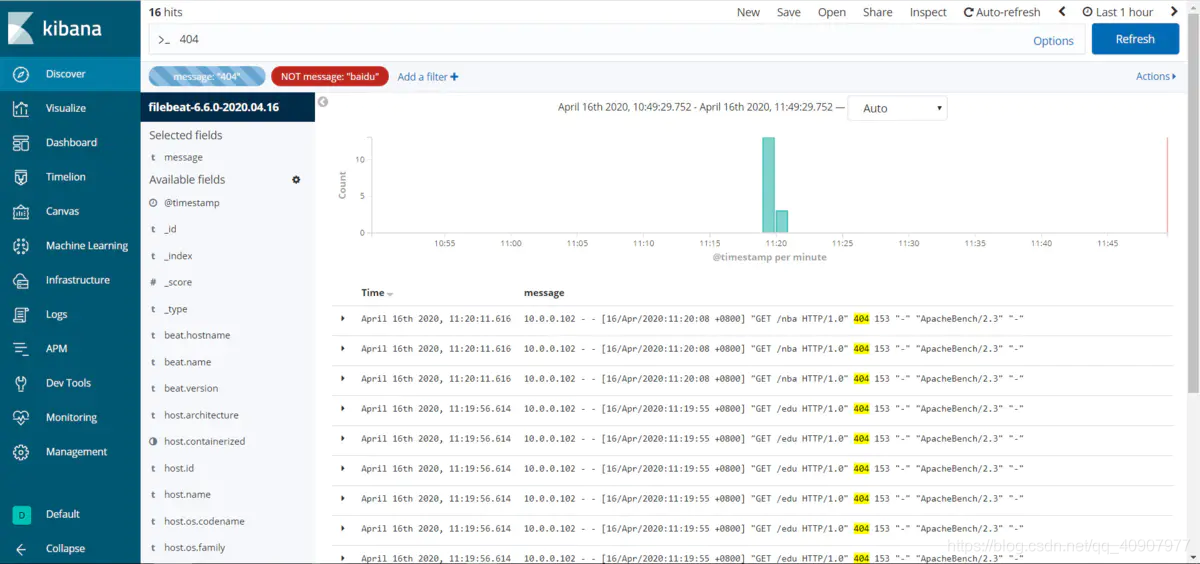
1.4 Kibana WEB-UI 配置


2. ELK收集Nginx Json格式的日
- 关闭filebeat服务:systemctl start filebeat
- 删除kibana管理的Index Pattern
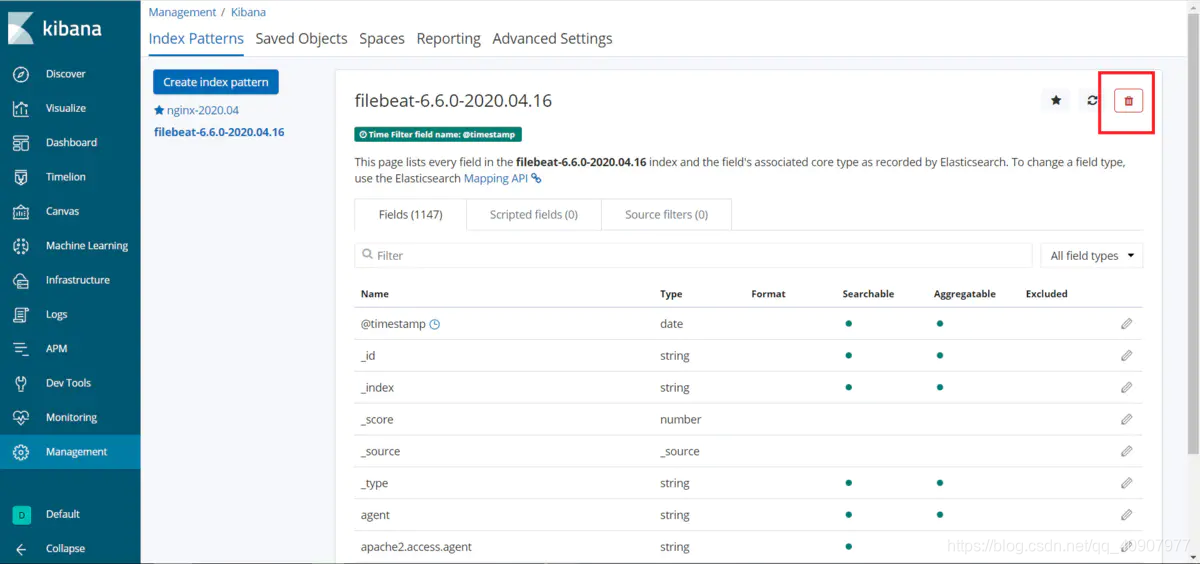
- 删除ES的index:DELETE filebeat-6.6.0-2020.04.16
- 清空Nginx日志:> /var/log/nginx/access.log
- 修改Nginx配置文件,重启Nginx
log_format json  '{"time_local": "$time_local", '
                          '"remote_addr": "$remote_addr", '
                          '"referer": "$http_referer", '
                          '"request": "$request", '
                          '"status": $status, '
                          '"bytes": $body_bytes_sent, '
                          '"agent": "$http_user_agent", '
                          '"x_forwarded": "$http_x_forwarded_for", '
                          '"up_addr": "$upstream_addr", '
                          '"up_host": "$upstream_http_host", '
                          '"upstream_time": "$upstream_response_time", '
                          '"request_time": "$request_time"}';

access_log  /var/log/nginx/access.log  json;
修改/etc/filebeat/filebeat.yml
filebeat.inputs:
- type: log
  enabled: true
  paths:
    - /var/log/nginx/access.log
  # 以下两行设置将nginx日志存储为json格式
  json.keys_under_root: true
  json.overwrite_keys: true

output.elasticsearch:
  hosts: ["10.0.0.100:9200","10.0.0.101:9200","10.0.0.102:9200"]
  # 设置index名,通常按月滚动
  index: "nginx-%{+yyyy.MM}"

# 当index被重写后,以下4个配置也必须重写
# 设置自定义的配置模板的名称
setup.template.name: "nginx"
# 保存到哪个index的时候使用此模板
setup.template.pattern: "nginx-*"
# 设置默认配置模板不可用
setup.template.enabled: false
# 设置自定义的配置模板可用
setup.template.overwrite: true
- 启动filebeat:systemctl start filebeat
- 发送测试数据
# 使用3个服务器发送请求
[root@node01 ~]# ab -c 100 -n 100 http://10.0.0.100:80/jingdong
[root@node01 ~]# ab -c 100 -n 100 http://10.0.0.100:80/
[root@node02 ~]# ab -c 100 -n 100 http://10.0.0.100:80/baidu
[root@node02 ~]# ab -c 100 -n 100 http://10.0.0.100:80/
[root@node03 ~]# ab -c 100 -n 100 http://10.0.0.100:80/taobao
[root@node03 ~]# ab -c 100 -n 100 http://10.0.0.100:80/
- 查看ES index
GET _cat/indices
green open nginx-2020.04             2l7iUDU9SpWDxN96ui2DhQ 5 1 600 0     1mb   502kb

GET nginx-2020.04/_search
{
  "took" : 4,
  "timed_out" : false,
  "_shards" : {
    "total" : 5,
    "successful" : 5,
    "skipped" : 0,
    "failed" : 0
  },
  "hits" : {
    "total" : 600,
    "max_score" : 1.0,
    "hits" : [
      {
        "_index" : "nginx-2020.04",
        "_type" : "doc",
        "_id" : "7KN_gXEB3XeAWkvtHPjB",
        "_score" : 1.0,
        "_source" : {
          "@timestamp" : "2020-04-16T05:38:42.359Z",
          "request_time" : "0.000",
          "up_host" : "-",
          "time_local" : "16/Apr/2020:13:34:01 +0800",
          "request" : "GET /baidu HTTP/1.0",
          "input" : {
            "type" : "log"
          },
          "beat" : {
            "version" : "6.6.0",
            "name" : "node01",
            "hostname" : "node01"
          },
          # nginx日志存储成了json格式
          "bytes" : 153,
          "remote_addr" : "10.0.0.101",
          "up_addr" : "-",
          "upstream_time" : "-",
          "x_forwarded" : "-",
          "referer" : "-",
          "agent" : "ApacheBench/2.3",
          "host" : {
            "name" : "node01",
            "os" : {
              "family" : "redhat",
              "name" : "CentOS Linux",
              "codename" : "Core",
              "platform" : "centos",
              "version" : "7 (Core)"
            },
            "id" : "ea70b3ad93714ed2be82e374ec284fe6",
            "containerized" : true,
            "architecture" : "x86_64"
          },
          "source" : "/var/log/nginx/access.log",
          "status" : 404,
          "offset" : 277900,
          "log" : {
            "file" : {
              "path" : "/var/log/nginx/access.log"
            }
          },
          "prospector" : {
            "type" : "log"
          }
        }
      }
      ......
    ]
  }
}
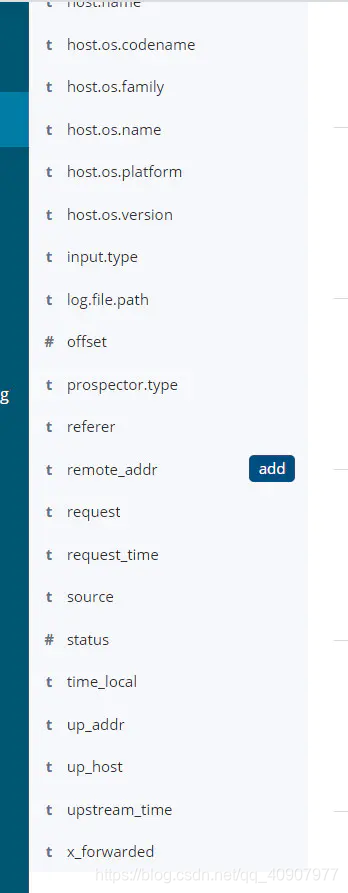
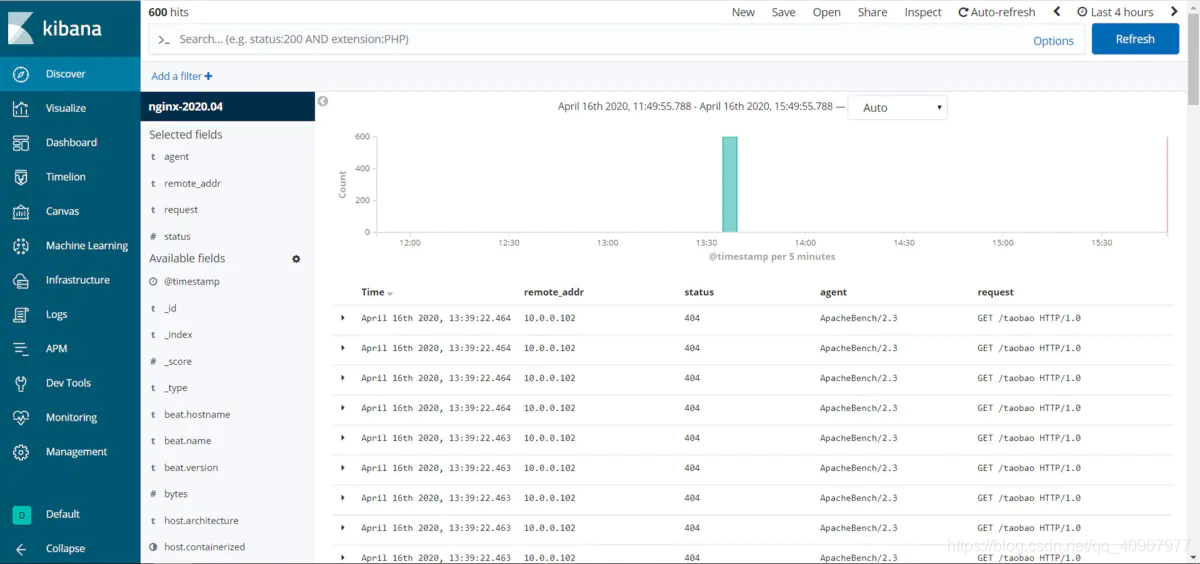
- Kibana WEB-UI的配置
重复步骤不再列出
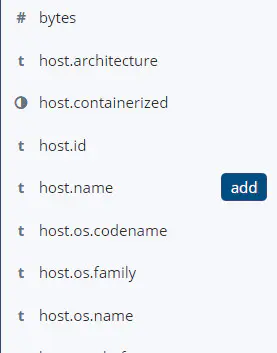
添加页面显示的字段
3. ELK收集多台Nginx服务器的日志
3.1 测试服务器架构
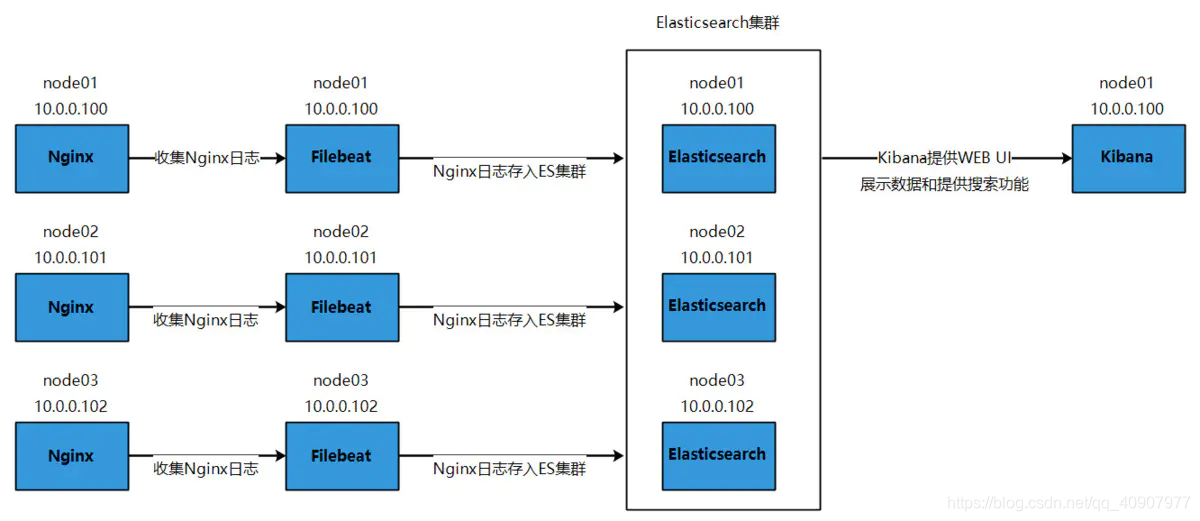
3.2 部署过程
- 3个节点的Nginx的配置同步后,启动Nginx服务
- 3个节点的filebeat配置同步后,启动filebeat
- 发送测试请求
# 使用3个服务器发送请求
[root@node01 ~]# ab -c 5 -n 5 http://10.0.0.101:80/test
[root@node01 ~]# ab -c 5 -n 5 http://10.0.0.102:80/test
[root@node02 ~]# ab -c 5 -n 5 http://10.0.0.100:80/test
[root@node02 ~]# ab -c 5 -n 5 http://10.0.0.102:80/test
[root@node03 ~]# ab -c 5 -n 5 http://10.0.0.100:80/test
[root@node03 ~]# ab -c 5 -n 5 http://10.0.0.101:80/test
- 检查数据
GET _cat/indices
# 数据增加了30条
green open nginx-2020.04             2l7iUDU9SpWDxN96ui2DhQ 5 1 630 0   1.8mb 921.4kb
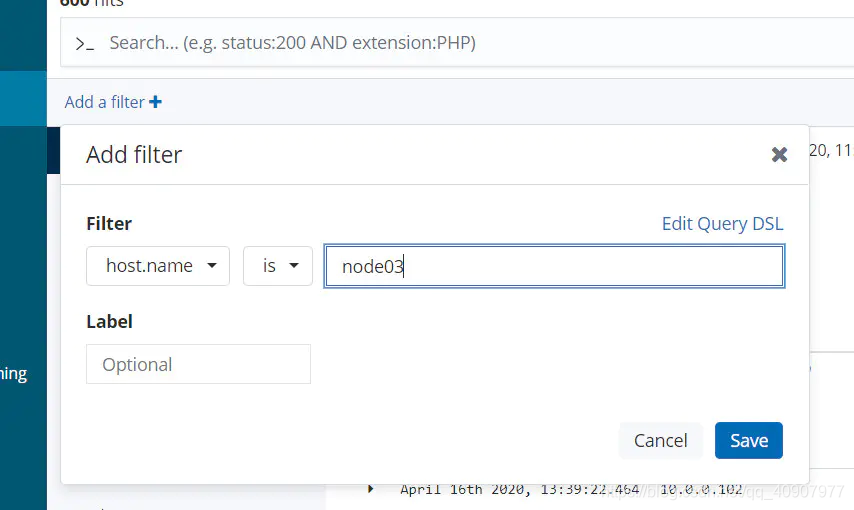
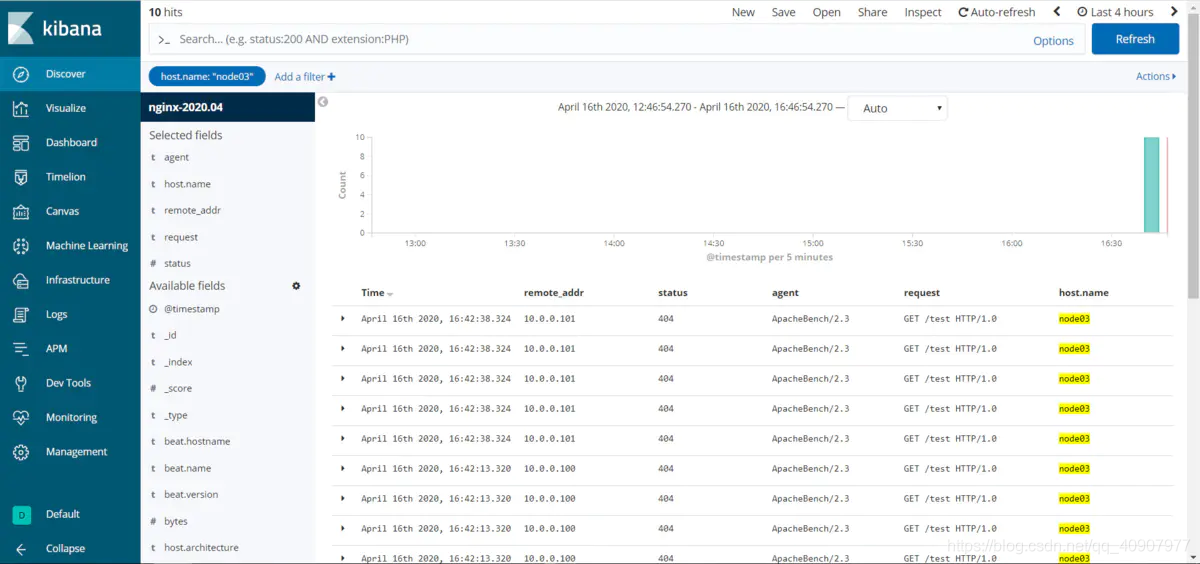
- 显示数据,添加host.name,并过滤出指定的主机收集到的日志
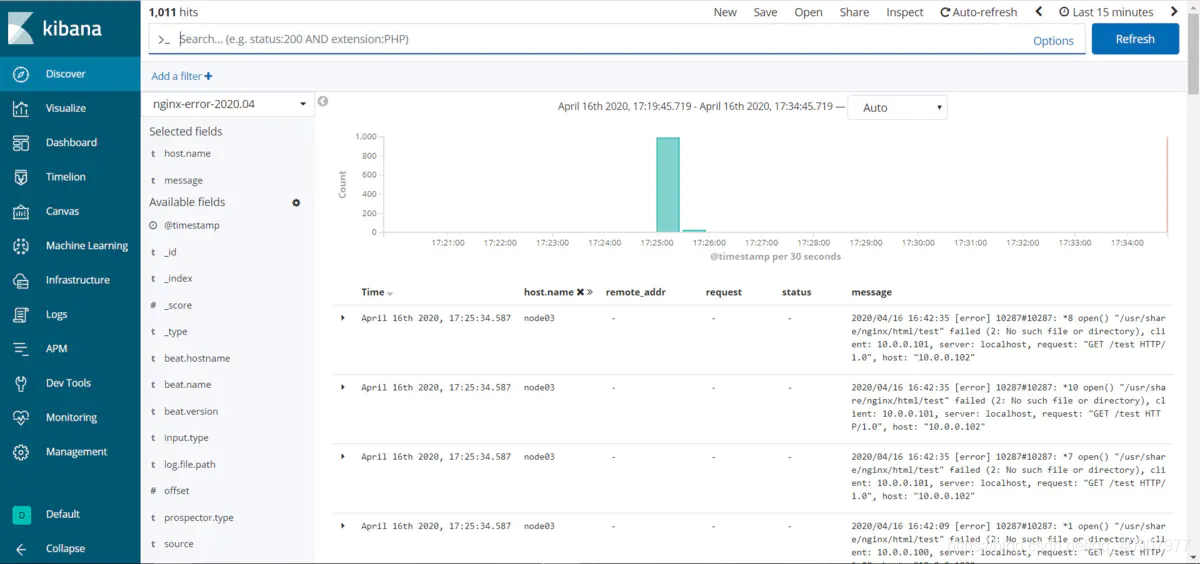
4. Nginx正常日志与错误日志拆分
- 修改filebeat配置并同步
filebeat.inputs:
- type: log
  enabled: true
  paths:
    - /var/log/nginx/access.log
  json.keys_under_root: true
  json.overwrite_keys: true
  tags: ["access"]
- type: log
  enabled: true
  # 错误日志不需要使用json格式,因为我们很少对错误日志进行聚合分析
  paths:
    - /var/log/nginx/error.log
  tags: ["error"]

output.elasticsearch:
  hosts: ["10.0.0.100:9200","10.0.0.101:9200","10.0.0.102:9200"]
  indices:
  - index: "nginx-access-%{+yyyy.MM}"
    when.contains:
      tags: "access"
  - index: "nginx-error-%{+yyyy.MM}"
    when.contains:
      tags: "error"

setup.template.name: "nginx"
setup.template.pattern: "nginx-*"
setup.template.enabled: false
setup.template.overwrite: true

setup.template.settings:
  # 设置目标index的shard个数
  index.number_of_shards: 3
# 设置kibana的IP和端口
setup.kibana:
  host: "10.0.0.100:5601"
- 重启filebeat
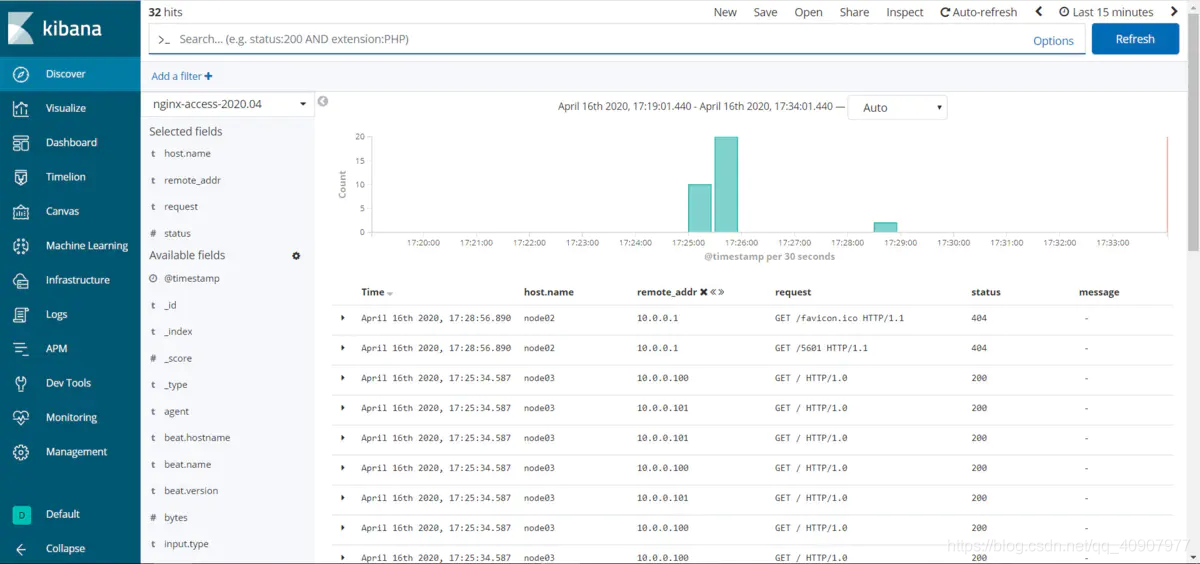
- 查看索引
GET _cat/indices
green open nginx-error-2020.04       723oaOL3SamTcJId6E--9Q 5 1 1011 0   1.5mb 738.8kb
green open nginx-access-2020.04      v-9G7VLeREKvfh9kg-Wi3g 5 1   30 0 394.6kb 197.3kb
参考链接 :
ELK收集Nginx日志 : https://www.jianshu.com/p/51f243132435
