数据可视化3
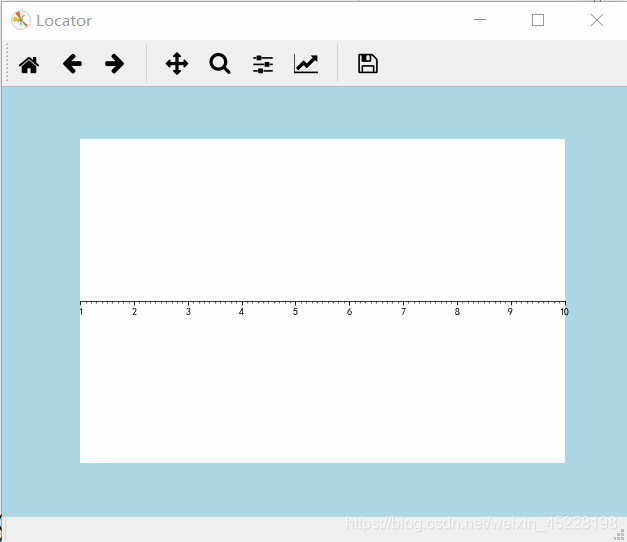
刻度定位器
from matplotlib import pyplot as plt
plt.figure("Locator",facecolor="lightblue")

#设置坐标轴
ax = plt.gca()
ax.spines["left"].set_color("none")
ax.spines["right"].set_color("none")
ax.spines["top"].set_color("none")
ax.spines["bottom"].set_color("black")
ax.spines["bottom"].set_position(("data",0.5))

plt.xlim(1,10)
plt.yticks([])

ax.xaxis.set_major_locator(plt.MultipleLocator(1))
ax.xaxis.set_minor_locator(plt.MultipleLocator(0.1))

plt.show()
其他的定位器

“plt.FixedLocator(locs=[2,8,10])” -->eval()–>转为代码
多试几个
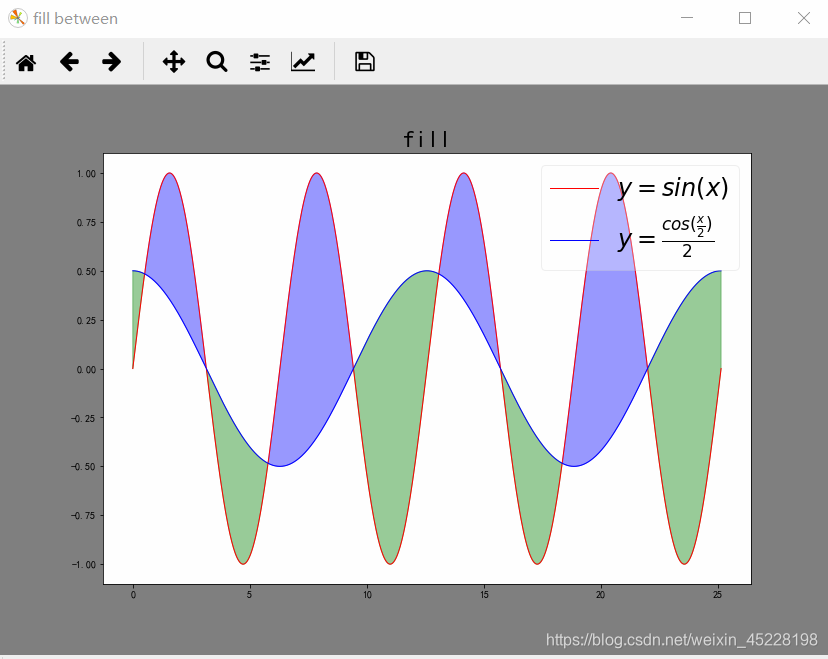
区域填充
plt.fill_between(x,lower,upper,upper>lower,color="green",alpha=0.5)
plt.fill_between(x,lower,upper,upper<lower,color="red",alpha=0.5)
from matplotlib import pyplot as plt
import numpy as np
x = np.linspace(0,8*np.pi,1000)
sinx = np.sin(x)
cosx = np.cos(x/2)/2

plt.figure("fill between",facecolor="gray")
plt.title("fill",fontsize=24)

plt.plot(x,sinx,"r-",lw=1,label="$y=sin(x)$")
plt.plot(x,cosx,"b-",lw=1,label=r"$y=\frac {cos(\frac {x} {2})} {2}$")

plt.fill_between(x,sinx,cosx,sinx>cosx,color="blue",alpha=0.4)
plt.fill_between(x,sinx,cosx,sinx<cosx,color="green",alpha=0.4)

plt.legend(loc="upper right",frameon=True,framealpha=0.3,fontsize=24)
plt.show()
随用随查
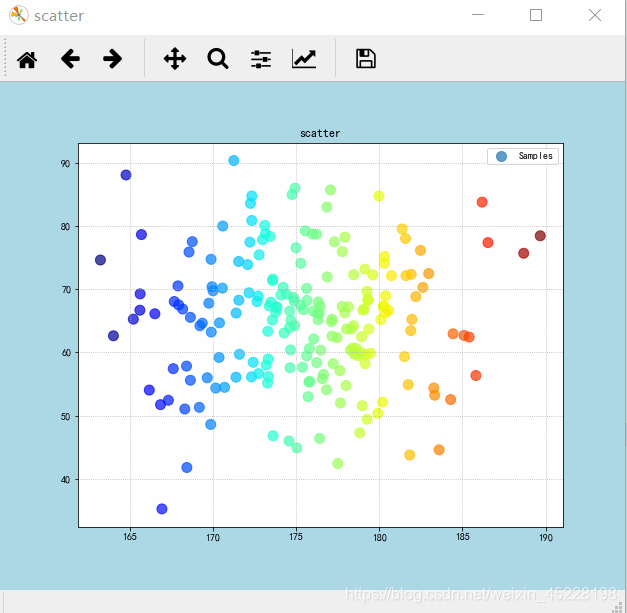
生成正太分布的数据点
import numpy as np
from matplotlib import pyplot as plt

plt.figure("scatter",facecolor="lightblue")
plt.title("scatter")

x = np.random.normal(175,5,200)
y = np.random.normal(65,10,200)

plt.scatter(x,y,s=100,c=x,cmap="jet",alpha=0.7,marker="o",label="Samples")

plt.grid(linestyle=":")
plt.legend(loc="best")
plt.show()