导入numpy库、pandas库和Matplotlib库
import pandas as pd
import numpy
import matplotlib.pyplot as plt

---------------------
导入文件
reviews = pd.read_csv("fandango_score_comparison.csv")
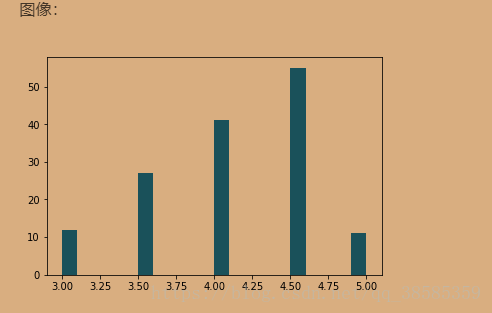
柱形图
生成一个柱形图:
#bist图(柱形图)
fig, ax = plt.subplots()

#ax.hist(norm_reviews['IMDB'])
#ax.hist(norm_reviews['IMDB'], bins = 20)
#range:设置图像显示的区间,bins:将数据等分为bins份
ax.hist(norm_reviews['Fandango_Stars'], range = (3, 5), bins = 20)
plt.show()

---------------------
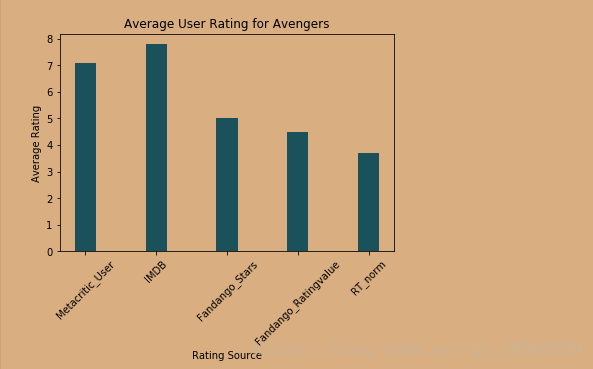
设置图像的参数:
#设置bar图
fig,ax = plt.subplots()
ax.bar(bar_positions, bar_hight, 0.3)

tick_position = range(1, 6)
ax.set_xticks(tick_position)
ax.set_xticklabels(num_cols, rotation = 45)

ax.set_xlabel('Rating Source')
ax.set_ylabel('Average Rating')
ax.set_title('Average User Rating for Avengers')

plt.show()

---------------------
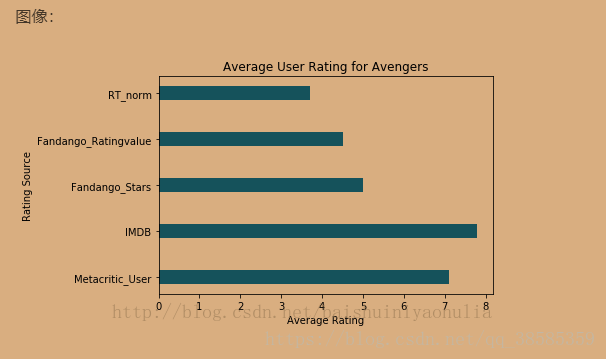
制作横着的条形图:
#设置横bar图
fig,ax = plt.subplots()
ax.barh(bar_positions, bar_hight, 0.3)

tick_position = range(1, 6)
ax.set_yticks(tick_position)
ax.set_yticklabels(num_cols)

ax.set_ylabel('Rating Source')
ax.set_xlabel('Average Rating')
ax.set_title('Average User Rating for Avengers')

plt.show()

---------------------
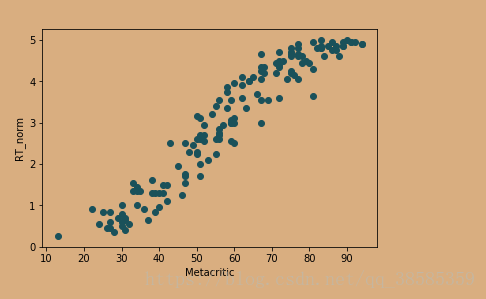
制作散点图:
cols = ['Metacritic', 'RT_norm']
new_reviews = reviews[cols]

fig, ax = plt.subplots()
ax.scatter(new_reviews['Metacritic'], new_reviews['RT_norm'])
ax.set_xlabel('Metacritic')
ax.set_ylabel('RT_norm')

plt.show()

---------------------