import matplotlib.pyplot as plt
import numpy as np


N = 5
y = [20, 30, 10, 25, 15]
index = np.arange(N)
plt.bar(left=index, height=y)
plt.show()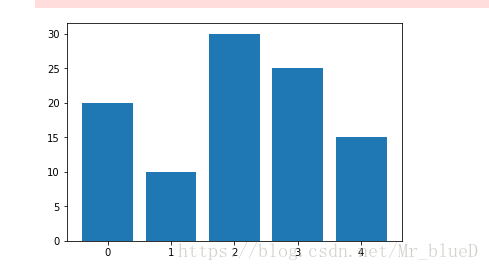
调整颜色与宽度
plt.bar(left=index, height=y, color='red', width=0.5)
plt.show()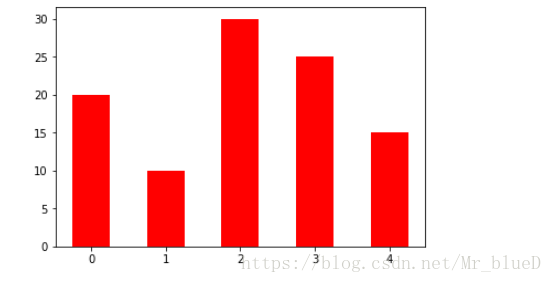
画水平条形图
plt.bar(left=0, bottom=index, width=y, height=0.5, color='red', orientation='horizontal')
plt.show()

# 或者
plt.barh(left=0, bottom=index, width=y, height=0.5,color='red')
plt.show()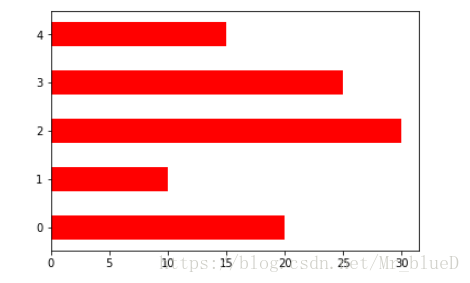
画并列条形图
A = [55, 45, 35, 25]
B = [10, 20, 30, 40]

index = np.arange(4)
bar_width = 0.3

plt.bar(left=index, height=A, width=bar_width, color='b')
plt.bar(left=index+bar_width, height=B, width=bar_width, color='r')
plt.show()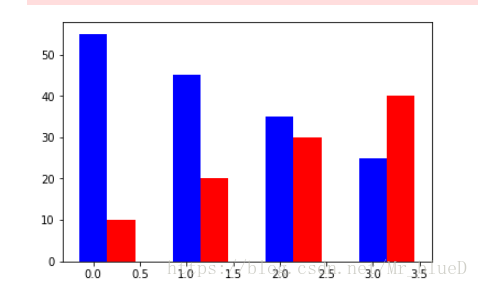
水平并列条形图
plt.bar(left=0, bottom=index, height=bar_width, width=A, color='b', orientation='horizontal')

plt.bar(left=0, bottom=index+bar_width, height=bar_width, width=B, color='r', orientation='horizontal')

# 或者
plt.barh(left=0, bottom=index, height=bar_width, width=A, color='b')
plt.barh(left=0, bottom=index+bar_width, height=bar_width, width=B, color='r')

plt.show()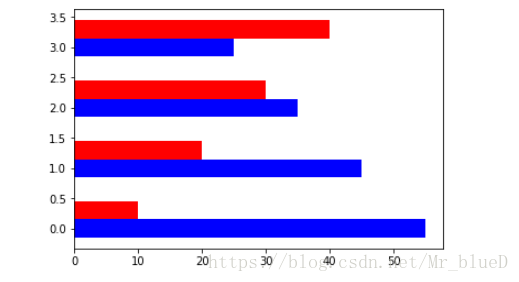
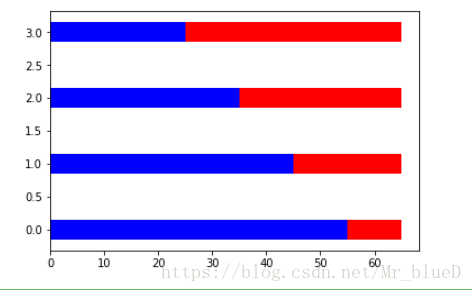
堆叠条形图
A = [55, 45, 35, 25]
B = [10, 20, 30, 40]

index = np.arange(4)
bar_width = 0.3

plt.bar(left=index, height=A, color='b', width=bar_width)
plt.bar(left=index, height=B, width=bar_width, color='r', bottom=A)
plt.show()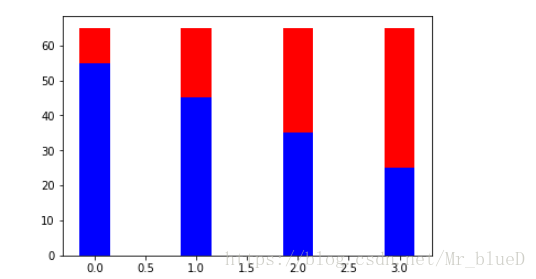
扫描二维码关注公众号,回复:
2422275 查看本文章

水平
plt.bar(left=0, bottom=index, height=bar_width, color='b', width=A, orientation='horizontal')

plt.bar(left=A, bottom=index, height=bar_width, width=B, color='r', orientation='horizontal')

# 或者
plt.barh(left=0, bottom=index, height=bar_width, color='b', width=A)

plt.barh(left=A, bottom=index, height=bar_width, width=B, color='r')

plt.show()