利用matplotlib绘制条形图
matplotlib是python中一种非常强大的绘图库,是数据分析必不可少的一部分,它可以把数据转化成统计图形的方式展示,这次是利用matplotlib来绘制条形图,matplotlib还可以绘制很多统计图形,比如:散点图、折线图、曲线图等等。这些图形案例都可以上matplotlib官网中去查看,官网上的案例都是代码,可以直接运行的,这样就更方便我们学习matplotlib(https://matplotlib.org/gallery/index.html)
首先导入matplotlib库
from matplotlib import pyplot as plt
from matplotlib import font_manager
这次只需要用到pyplot和font_manager这两个方法,font_manager使用来设置中文字体,因为有时候刻度或者标题需要展示中文,所以要设置中文字体
准备数据
# 设置两个数据,关于2017年各电影票房
movie_name = ['战狼2','速度与激情8','羞羞的铁拳','前任3:再见前任','功夫瑜伽','西游伏妖篇','变形金刚5:最后的骑士','芳华','摔跤吧!爸爸','寻梦环游记']
movie_box = [53.39,26.49,21.9,19.26,17.53,16.49,15.45,14.11,12.96,12.02]
设置图形大小和像素
plt.figure(figsize=(20,18),dpi=80)
figsize传递的参数是图形大小,dpi是像素
绘图
# r = plt.bar(range(len(movie_name)),movie_box,width=0.4,color='MidnightBlue')#barh是代表绘制横向条形图,而bar就是代表直的条形图
这里要用一个参数来接收plt.bar的数据,用于后面展示坐标,也可以不用设参数来接收同样能够展示图形,len(movie_name)是代表x坐标轴,movie_box表示y轴。width是代表条形图的宽度,范围是0~1,color传递的是条形图的颜色。
设置中文字体
zh_font = font_manager.FontProperties(fname=r'D:\mypathon3\python\font.ttc')
要先下载中文字体的ttc文件
绘制X轴刻度
plt.xticks(range(len(movie_name)),movie_name,fontproperties=zh_font)
因为原先x轴的刻度是len(movie_name),所以这里绘制x轴刻度是要遍历len(movie_name)然后用movie_name电影名一一对应上。因为电影名是中文,所以要传递中文字体的参数,用fontproperties传参。
绘制y轴刻度也是一样,plt.yticks()
绘制网格线
plt.grid(alpha=0.5,color='plum')
alpha传递的是网格线的透明度,color传递的是网格线的颜色。
保存图片
plt.savefig(r'I:\crack\img\movie3.png',bbox_inches = 'tight')
传递bbox_inches参数是为了保存完整的图片,因为我发现这个图如果不传递bbox_inches无法展现全部内容。
条形图的坐标
for rects in r:
    height = rects.get_height()
    plt.text(rects.get_x() + rects.get_width()/2,1.03*height,'%s'%float(height),fontsize = 18,ha='center')
plt.bar().text(x, y, s, fontdict=fontdict, withdash=withdash, **kwargs,fontsize = 18,ha=‘center’)
先遍历图形信息,然后获得条形图坐标的高,x 和y的参数是表示坐标位置,s传递的参数是要在坐标上展示的数据,就是条形图y轴的坐标。而fontsize是代表字体的大小,ha代表在横向位置上的位置。
最后展示图形
plt.show()
绘制多条条形图
首先准备数据
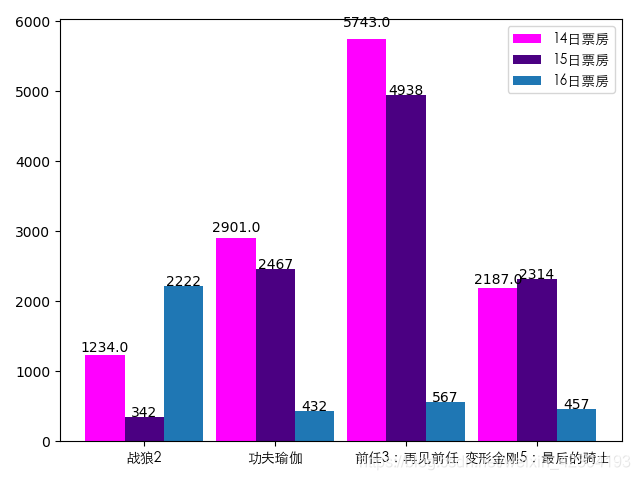
movie_name = ['战狼2','功夫瑜伽','前任3:再见前任','变形金刚5:最后的骑士']
day_14 = [1234,2901,5743,2187]
day_15 = [342,2467,4938,2314]
day_16 = [2222,432,567,457]
四部电影在三天票房的对比,因为多条条形图和一条条形图有些代码是一样的,这里就不做过多的解释了。
准备X轴
bar_width = 0.3
x_14 = list(range(len(movie_name)))
x_15 = [i + bar_width for i in x_14]
x_16 = [i + bar_width*2 for i in x_14]
这里设定每条条形图的宽度都是0.3,因为三条条形图要贴在一起所以要遍历x轴。
绘图
rect_1 = plt.bar(x_14,day_14,width=bar_width,label = '14日票房',color = 'Magenta')
rect_2 = plt.bar(x_15,day_15,width=bar_width,label = '15日票房',color = 'Indigo')
rect_3 = plt.bar(x_16,day_16,width=bar_width,label = '16日票房')
这里的绘图多了一个label,这个变量是用来制作图例。
绘制X轴刻度
plt.xticks(x_15,movie_name,fontproperties=zh_font)
这里因为三条条形图x轴的刻度都是一样的,所以只需要传递一个参数,因为要在中间展示,所以就放在第二条的位置上。
绘制图例
plt.legend(prop = zh_font)
这里的图例也是用中文展示,所以也要传递中文字体
绘制坐标
for rect_1s in rect_1:
    height = rect_1s.get_height()
    plt.text(rect_1s.get_x() + rect_1s.get_width()/2,1.03*height,'%s'%float(height),ha='center')

for rect_2s in rect_2:
    heights = rect_2s.get_height()
    plt.text(rect_2s.get_x() + rect_2s.get_width()/2,heights,int(heights),ha='center')

for rect_3s in rect_3:
    heights = rect_3s.get_height()
    plt.text(rect_3s.get_x() + rect_3s.get_width()/2,heights,int(heights),ha='center')
多条条形图的源代码
movie_name = ['战狼2','功夫瑜伽','前任3:再见前任','变形金刚5:最后的骑士']
day_14 = [1234,2901,5743,2187]
day_15 = [342,2467,4938,2314]
day_16 = [2222,432,567,457]

#设置中文字体
zh_font = font_manager.FontProperties(fname=r'D:\mypathon3\python\font.ttc')

#准备X轴,宽带为0.3
bar_width = 0.3
x_14 = list(range(len(movie_name)))
x_15 = [i + bar_width for i in x_14]
x_16 = [i + bar_width*2 for i in x_14]

#绘图
rect_1 = plt.bar(x_14,day_14,width=bar_width,label = '14日票房',color = 'Magenta')
rect_2 = plt.bar(x_15,day_15,width=bar_width,label = '15日票房',color = 'Indigo')
rect_3 = plt.bar(x_16,day_16,width=bar_width,label = '16日票房')

#X轴的刻度
plt.xticks(x_15,movie_name,fontproperties=zh_font)

#图例
plt.legend(prop = zh_font)
#坐标
for rect_1s in rect_1:
    height = rect_1s.get_height()
    plt.text(rect_1s.get_x() + rect_1s.get_width()/2,1.03*height,'%s'%float(height),ha='center')

for rect_2s in rect_2:
    heights = rect_2s.get_height()
    plt.text(rect_2s.get_x() + rect_2s.get_width()/2,heights,int(heights),ha='center')

for rect_3s in rect_3:
    heights = rect_3s.get_height()
    plt.text(rect_3s.get_x() + rect_3s.get_width()/2,heights,int(heights),ha='center')

plt.show()