04图与网络
1.最短路
(1) 自己写的dijstra算法
format compact;
clc,clear all
a=zeros(6);
a(1,2)=50;a(1,4)=40;a(1,5)=25;a(1,6)=10;
a(2,3)=15;a(2,4)=20;a(2,6)=25;
a(3,4)=10;a(3,5)=20;
a(4,5)=10;a(4,6)=25;
a(5,6)=55;
a=a+a'
a(find(a==0))=inf %将a=0的数全部替换为无强大
pb(1:length(a))=0;pb(1)=1;  %当一个点已经求出到原点的最短距离时,其下标i对应的pb(i)赋1
index1=1; %存放存入S集合的顺序
index2=ones(1,length(a)); %存放始点到第i点最短通路中第i顶点前一顶点的序号
d(1:length(a))=inf;d(1)=0;  %存放由始点到第i点最短通路的值
temp=1;  %temp表示c1,算c1到其它点的最短路。
while sum(pb)<length(a)  %看是否所有的点都标记为P标号
    tb=find(pb==0); %找到标号为0的所有点,即找到还没有存入S的点
    d(tb)=min(d(tb),d(temp)+a(temp,tb));%计算标号为0的点的最短路,或者是从原点直接到这个点,又或者是原点经过r1,间接到达这个点
    tmpb=find(d(tb)==min(d(tb)));  %求d[tb]序列最小值的下标
    temp=tb(tmpb(1));%可能有多条路径同时到达最小值,却其中一个,temp也从原点变为下一个点
    pb(temp)=1;%找到最小路径的表对应的pb(i)=1
    index1=[index1,temp];  %存放存入S集合的顺序
    temp2=find(d(index1)==d(temp)-a(temp,index1));
    index2(temp)=index1(temp2(1)); %记录标号索引
end
d, index1, index2
a =
     0    50     0    40    25    10
    50     0    15    20     0    25
     0    15     0    10    20     0
    40    20    10     0    10    25
    25     0    20    10     0    55
    10    25     0    25    55     0
a =
   Inf    50   Inf    40    25    10
    50   Inf    15    20   Inf    25
   Inf    15   Inf    10    20   Inf
    40    20    10   Inf    10    25
    25   Inf    20    10   Inf    55
    10    25   Inf    25    55   Inf
d =
     0    35    45    35    25    10
index1 =
     1     6     5     2     4     3
index2 =
     1     6     5     6     1     1
(2) 输入邻接矩阵带包
format compact;
% 输入邻接矩阵
clc,clear
a=zeros(7);
a(1,2)=4;a(1,3)=2;
a(2,3)=3;a(2,4)=4;a(2,5)=6;
a(3,4)=5;a(3,6)=4;
a(4,5)=2;a(4,6)=7;
a(5,6)=4;a(5,7)=8;
a(6,7)=3;
b=sparse(a); % 构造稀疏矩阵
[x,y,z]=graphshortestpath(b,1,7,'Directed',1,'Method','Bellman-Ford')
% 有向图,Directed为1为真,方法(Method)默认为Dijstra
p=biograph(b,[],'showW','on');
h=view(p);%显示各个路径权值


% 求节点1到节点5的最短路径
[Dist,Path]=graphshortestpath(b,1,7)

% 将最短路径的结点以红色显示
set(h.Nodes(Path),'Color',[1 0.4 0.4]);
% 将最短路径的弧以红色显示
edges=getedgesbynodeid(h,get(h.Nodes(Path),'ID'));
set(edges,'LineColor',[1 0 0]);

(3) 输入节点和权重带包
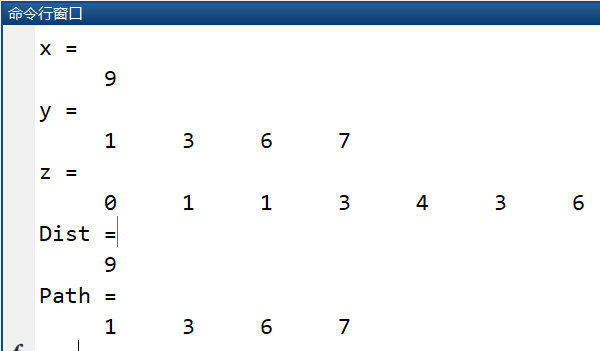
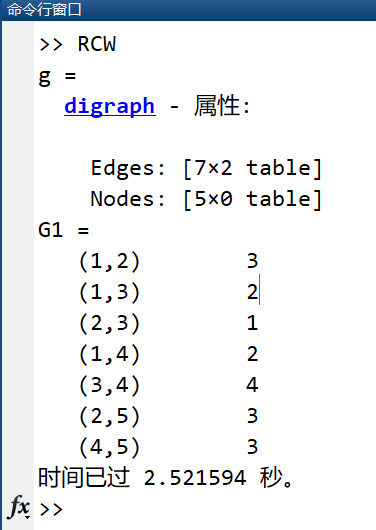
format compact;
% 输入起点终点和边长
tic
R = [1,1,1,2,2,3,4];                    % 起点节点
C = [2,3,4,3,5,4,5];                    % 终点节点
W = [3,2,2,1,3,4,3];                    % 对应权值
g = digraph(R,C,W)                     % 创建图
G1=sparse(R,C,W)
[path,distance] = shortestpath(g,1,5);  % 计算最短路
plot(g)
toc

扫描二维码关注公众号,回复:
7076440 查看本文章

format compact;
s = [1 1 2 2 3 4];  % 起始节点向量
e = [2 3 4 5 5 5];  % 终止节点向量
w = [1 4 2 3 2 2];  % 权向量
g = sparse(s,e,w);  % 构建稀疏矩阵
g(5,5)=0;   % 使稀疏矩阵其余元素为0

p=biograph(g,[],'ShowWeights','on');%建立有向图对象P
h=view(p);%显示各个路径权值

% 求节点1到节点5的最短路径
[Dist,Path]=graphshortestpath(g,1,5,'Method','Dijkstra')

% 将最短路径的结点以红色显示
set(h.Nodes(Path),'Color',[1 0.4 0.4]);
% 将最短路径的弧以红色显示
edges=getedgesbynodeid(h,get(h.Nodes(Path),'ID'));
set(edges,'LineColor',[1 0 0]);
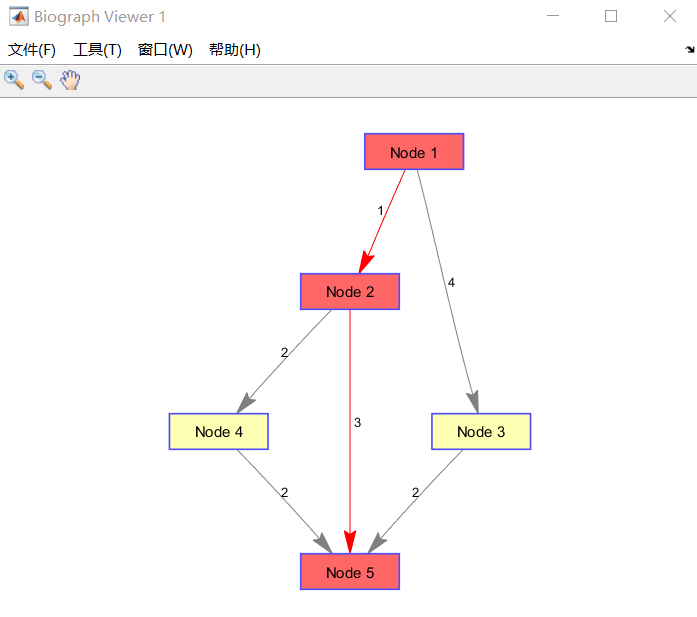
>> RCW01
Dist =
     4
Path =
     1     2     5
2.最小生成树
format compact;
clc,clear
x=[0 5 16 20 33 23 35 25 10];
y=[15 20 24 20 25 11 7 0 3];
xy=[x;y] % xy 2行9列
d=mandist(xy) % 求xy的两两列向量间的绝对值距离(9个点两两的距离)
d=tril(d) % 截取matlab工具箱要求的下三角矩阵
G=sparse(d) % 转化为稀疏矩阵
[ST,pred]=graphminspantree(G,'method','Kruskal') % 调用最小生成树命令
st=full(ST) % 把最小生成树的稀疏矩阵转化为普通矩阵
TreeLength=sum(sum(st)) % 求最小生成树的长度
view(biograph(ST,[],'ShowArrows','off','ShowWeights','on')) % 画出最小生成树

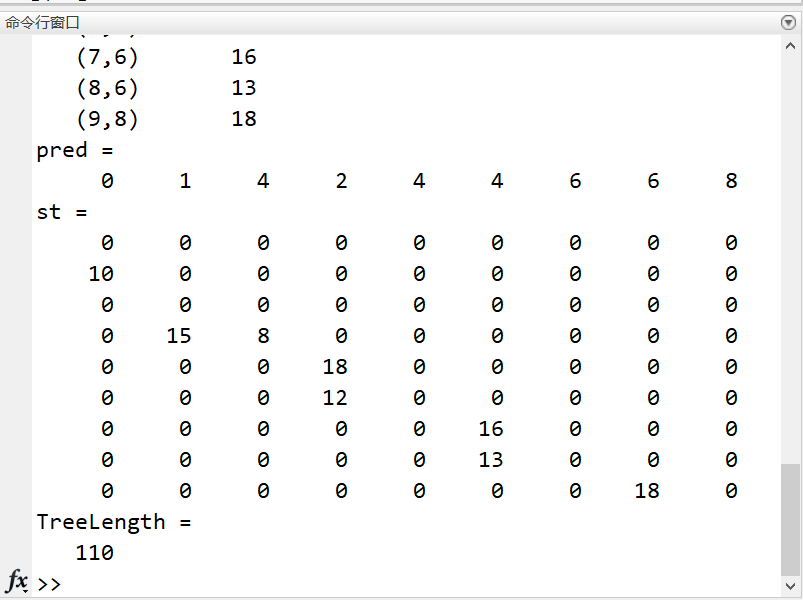


xy =
     0     5    16    20    33    23    35    25    10
    15    20    24    20    25    11     7     0     3
d =
     0    10    25    25    43    27    43    40    22
    10     0    15    15    33    27    43    40    22
    25    15     0     8    18    20    36    33    27
    25    15     8     0    18    12    28    25    27
    43    33    18    18     0    24    20    33    45
    27    27    20    12    24     0    16    13    21
    43    43    36    28    20    16     0    17    29
    40    40    33    25    33    13    17     0    18
    22    22    27    27    45    21    29    18     0
d =
     0     0     0     0     0     0     0     0     0
    10     0     0     0     0     0     0     0     0
    25    15     0     0     0     0     0     0     0
    25    15     8     0     0     0     0     0     0
    43    33    18    18     0     0     0     0     0
    27    27    20    12    24     0     0     0     0
    43    43    36    28    20    16     0     0     0
    40    40    33    25    33    13    17     0     0
    22    22    27    27    45    21    29    18     0
G =
   (2,1)       10
   (3,1)       25
   (4,1)       25
   (5,1)       43
   (6,1)       27
   (7,1)       43
   (8,1)       40
   (9,1)       22
   (3,2)       15
   (4,2)       15
   (5,2)       33
   (6,2)       27
   (7,2)       43
   (8,2)       40
   (9,2)       22
   (4,3)        8
   (5,3)       18
   (6,3)       20
   (7,3)       36
   (8,3)       33
   (9,3)       27
   (5,4)       18
   (6,4)       12
   (7,4)       28
   (8,4)       25
   (9,4)       27
   (6,5)       24
   (7,5)       20
   (8,5)       33
   (9,5)       45
   (7,6)       16
   (8,6)       13
   (9,6)       21
   (8,7)       17
   (9,7)       29
   (9,8)       18
ST =
   (2,1)       10
   (4,2)       15
   (4,3)        8
   (5,4)       18
   (6,4)       12
   (7,6)       16
   (8,6)       13
   (9,8)       18
pred =
     0     1     4     2     4     4     6     6     8
st =
     0     0     0     0     0     0     0     0     0
    10     0     0     0     0     0     0     0     0
     0     0     0     0     0     0     0     0     0
     0    15     8     0     0     0     0     0     0
     0     0     0    18     0     0     0     0     0
     0     0     0    12     0     0     0     0     0
     0     0     0     0     0    16     0     0     0
     0     0     0     0     0    13     0     0     0
     0     0     0     0     0     0     0    18     0
TreeLength =
   110
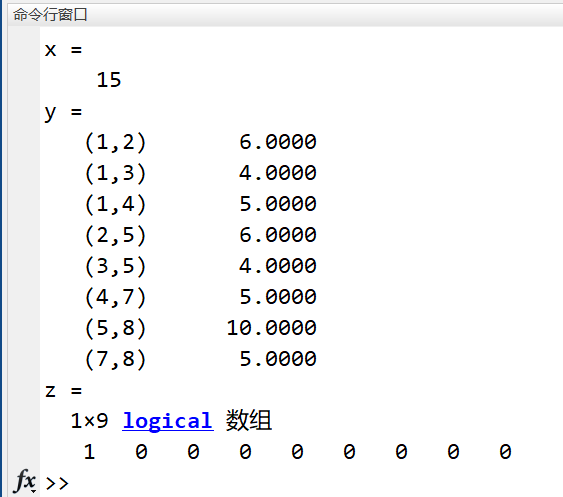
3.最大流
format compact;
% 最大流
% 只能解决权重都为正值,且两个顶点之间不能有两条弧的问题
% 本来a(3,4)=5,a(4,3)=2,增加虚拟节点9,删去a(4,3)=2,改为a(4,9)=2;a(9,3)=2;

clc,clear,a=zeros(9);
a(1,2)=6;a(1,3)=4;a(1,4)=5;
a(2,3)=3;a(2,5)=9;a(2,6)=9;
a(3,4)=5;a(3,5)=6;a(3,6)=7;a(3,7)=3;
a(4,7)=5;a(4,9)=2;
a(5,8)=12;
a(6,5);a(6,8)=10;
a(7,6)=4;a(7,8)=15;
a(9,3)=2;
G=sparse(a);
view(biograph(G,[],'ShowWeights','on')); % 建立有向图对象
[x,y,z]=graphmaxflow(G,1,8) % 最大流量为x=15