import matplotlib.pyplot as plt
import numpy as np
from scipy import stats
from matplotlib import style
style.use('fivethirtyeight')
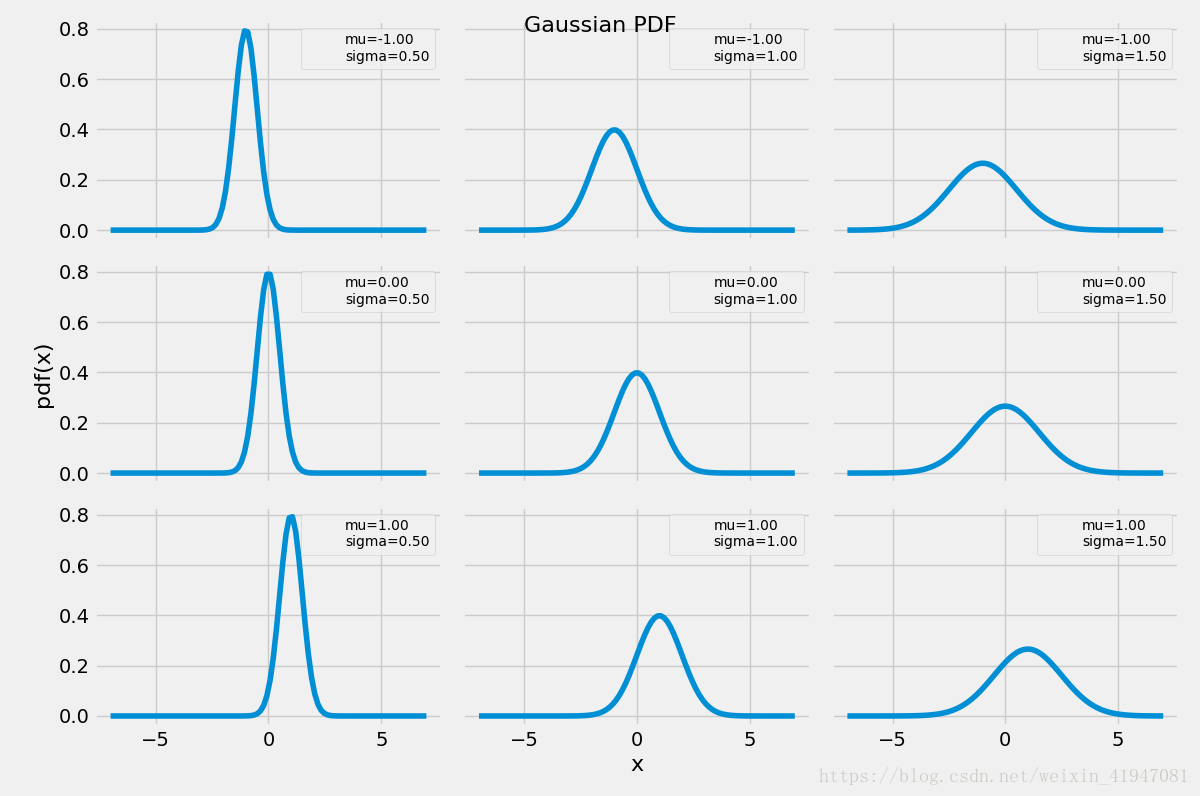
mu_params = [-1, 0, 1]
sd_params = [0.5, 1, 1.5]
x = np.linspace(-7, 7, 100)
f, ax = plt.subplots(len(mu_params), len(sd_params), sharex=True, sharey=True, figsize=(12,8))
for i in range(3):
for j in range(3):
mu = mu_params[i]
sd = sd_params[j]
y = stats.norm(mu, sd).pdf(x)
ax[i, j].plot(x, y)
ax[i, j].plot(0,0, label='mu={:3.2f}\nsigma={:3.2f}'.format(mu,sd), alpha=0)
ax[i, j].legend(fontsize=10)
ax[2,1].set_xlabel('x', fontsize=16)
ax[1,0].set_ylabel('pdf(x)', fontsize=16)
plt.suptitle('Gaussian PDF', fontsize=16)
plt.tight_layout()
plt.show()
python高斯分布概率密度函数
猜你喜欢
转载自blog.csdn.net/weixin_41947081/article/details/81105222
今日推荐
周排行